Dollar General 2011 Annual Report Download - page 160
Download and view the complete annual report
Please find page 160 of the 2011 Dollar General annual report below. You can navigate through the pages in the report by either clicking on the pages listed below, or by using the keyword search tool below to find specific information within the annual report.-
 1
1 -
2
-
3
-
4
-
5
-
6
-
7
-
8
-
9
-
10
-
11
-
12
-
13
-
14
-
15
-
16
-
17
-
18
-
19
-
20
-
21
-
22
-
23
-
24
-
25
-
26
-
27
-
28
-
29
-
30
-
31
-
32
-
33
-
34
-
35
-
36
-
37
-
38
-
39
-
40
-
41
-
42
-
43
-
44
-
45
-
46
-
47
-
48
-
49
-
50
-
51
-
52
-
53
-
54
-
55
-
56
-
57
-
58
-
59
-
60
-
61
-
62
-
63
-
64
-
65
-
66
-
67
-
68
-
69
-
70
-
71
-
72
-
73
-
74
-
75
-
76
-
77
-
78
-
79
-
80
-
81
-
82
-
83
-
84
-
85
-
86
-
87
-
88
-
89
-
90
-
91
-
92
-
93
-
94
-
95
-
96
-
97
-
98
-
99
-
100
-
101
-
102
-
103
-
104
-
105
-
106
-
107
-
108
-
109
-
110
-
111
-
112
-
113
-
114
-
115
-
116
-
117
-
118
-
119
-
120
-
121
-
122
-
123
-
124
-
125
-
126
-
127
-
128
-
129
-
130
-
131
-
132
-
133
-
134
-
135
-
136
-
137
-
138
-
139
-
140
-
141
-
142
-
143
-
144
-
145
-
146
-
147
-
148
-
149
-
 150
150 -
 151
151 -
 152
152 -
 153
153 -
 154
154 -
 155
155 -
 156
156 -
 157
157 -
 158
158 -
 159
159 -
 160
160 -
 161
161 -
 162
162 -
 163
163 -
 164
164 -
 165
165 -
 166
166 -
 167
167 -
 168
168 -
 169
169 -
 170
170 -
171
-
172
-
173
-
174
-
175
-
176
-
177
-
178
-
179
-
180
-
181
-
182
-
183
-
184
-
185
-
186
-
187
-
188
-
189
-
190
-
191
-
192
-
193
-
194
-
195
-
196
-
197
-
198
-
199
-
200
-
201
-
202
-
203
-
204
-
205
-
206
-
207
-
208
-
209
-
210
-
211
-
212
-
213
-
214
-
215
-
216
-
217
-
218
-
219
-
220
 |
 |

10-K
DOLLAR GENERAL CORPORATION AND SUBSIDIARIES
NOTES TO CONSOLIDATED FINANCIAL STATEMENTS (Continued)
1. Basis of presentation and accounting policies (Continued)
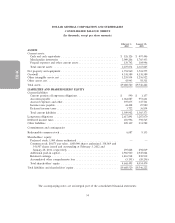
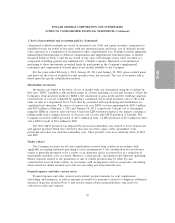
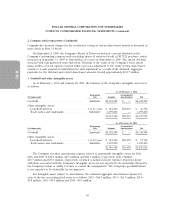
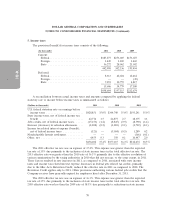
Property and equipment
In 2007, as the result of a merger transaction, the Company’s property and equipment was
recorded at estimated fair values. Property and equipment acquired subsequent to the merger has been
recorded at cost. The Company’s property and equipment is summarized as follows:
February 3, January 28,
(In thousands) 2012 2011
Land and land improvements ...................... $ 204,562 $ 174,439
Buildings ..................................... 622,849 575,305
Leasehold improvements ......................... 213,852 173,836
Furniture, fixtures and equipment ................... 1,500,268 1,235,756
Construction in progress .......................... 139,454 17,933
2,680,985 2,177,269
Less accumulated depreciation and amortization ........ 886,025 652,694
Net property and equipment ....................... $1,794,960 $1,524,575
The Company provides for depreciation and amortization on a straight-line basis over the
following estimated useful lives (in years):
Land improvements ......................................... 20
Buildings ................................................. 39 - 40
Leasehold improvements ..................................... (a)
Furniture, fixtures and equipment ............................... 3 - 10
(a) amortized over the shorter of the life of the applicable lease term or the estimated useful
life of the asset
Depreciation expense related to property and equipment was approximately $243.7 million,
$215.7 million and $201.1 million for 2011, 2010 and 2009. Amortization of capital lease assets is
included in depreciation expense. Interest on borrowed funds during the construction of property and
equipment is capitalized where applicable. Interest costs of $1.5 million were capitalized in 2011. No
interest costs were capitalized in 2010 or 2009.
Impairment of long-lived assets
When indicators of impairment are present, the Company evaluates the carrying value of long-lived
assets, other than goodwill, in relation to the operating performance and future cash flows or the
appraised values of the underlying assets. In accordance with accounting standards for long-lived assets,
the Company reviews for impairment stores open more than two years for which current cash flows
from operations are negative. Impairment results when the carrying value of the assets exceeds the
undiscounted future cash flows over the life of the lease. The Company’s estimate of undiscounted
future cash flows over the lease term is based upon historical operations of the stores and estimates of
future store profitability which encompasses many factors that are subject to variability and difficult to
predict. If a long-lived asset is found to be impaired, the amount recognized for impairment is equal to
the difference between the carrying value and the asset’s estimated fair value. The fair value is
60