Dollar General 2011 Annual Report Download - page 172
Download and view the complete annual report
Please find page 172 of the 2011 Dollar General annual report below. You can navigate through the pages in the report by either clicking on the pages listed below, or by using the keyword search tool below to find specific information within the annual report.-
 1
1 -
2
-
3
-
4
-
5
-
6
-
7
-
8
-
9
-
10
-
11
-
12
-
13
-
14
-
15
-
16
-
17
-
18
-
19
-
20
-
21
-
22
-
23
-
24
-
25
-
26
-
27
-
28
-
29
-
30
-
31
-
32
-
33
-
34
-
35
-
36
-
37
-
38
-
39
-
40
-
41
-
42
-
43
-
44
-
45
-
46
-
47
-
48
-
49
-
50
-
51
-
52
-
53
-
54
-
55
-
56
-
57
-
58
-
59
-
60
-
61
-
62
-
63
-
64
-
65
-
66
-
67
-
68
-
69
-
70
-
71
-
72
-
73
-
74
-
75
-
76
-
77
-
78
-
79
-
80
-
81
-
82
-
83
-
84
-
85
-
86
-
87
-
88
-
89
-
90
-
91
-
92
-
93
-
94
-
95
-
96
-
97
-
98
-
99
-
100
-
101
-
102
-
103
-
104
-
105
-
106
-
107
-
108
-
109
-
110
-
111
-
112
-
113
-
114
-
115
-
116
-
117
-
118
-
119
-
120
-
121
-
122
-
123
-
124
-
125
-
126
-
127
-
128
-
129
-
130
-
131
-
132
-
133
-
134
-
135
-
136
-
137
-
138
-
139
-
140
-
141
-
142
-
143
-
144
-
145
-
146
-
147
-
148
-
149
-
150
-
151
-
152
-
153
-
154
-
155
-
156
-
157
-
158
-
159
-
160
-
161
-
 162
162 -
 163
163 -
 164
164 -
 165
165 -
 166
166 -
 167
167 -
 168
168 -
 169
169 -
 170
170 -
 171
171 -
 172
172 -
 173
173 -
 174
174 -
 175
175 -
 176
176 -
 177
177 -
 178
178 -
 179
179 -
 180
180 -
 181
181 -
 182
182 -
183
-
184
-
185
-
186
-
187
-
188
-
189
-
190
-
191
-
192
-
193
-
194
-
195
-
196
-
197
-
198
-
199
-
200
-
201
-
202
-
203
-
204
-
205
-
206
-
207
-
208
-
209
-
210
-
211
-
212
-
213
-
214
-
215
-
216
-
217
-
218
-
219
-
220
 |
 |

10-K
DOLLAR GENERAL CORPORATION AND SUBSIDIARIES
NOTES TO CONSOLIDATED FINANCIAL STATEMENTS (Continued)
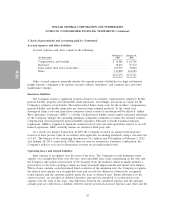
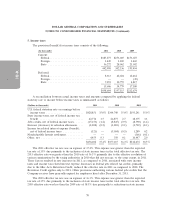
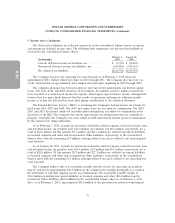
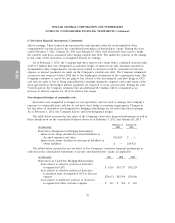
5. Income taxes (Continued)
Net deferred tax liabilities are reflected separately on the consolidated balance sheets as current
and noncurrent deferred income taxes. The following table summarizes net deferred tax liabilities as
recorded in the consolidated balance sheets:
February 3, January 28,
(In thousands) 2012 2011
Current deferred income tax liabilities, net .............. $ (3,722) $ (36,854)
Noncurrent deferred income tax liabilities, net ........... (656,996) (598,565)
Net deferred tax liabilities .......................... $(660,718) $(635,419)
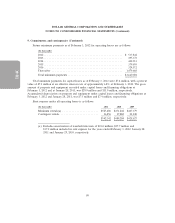
The Company has state net operating loss carryforwards as of February 3, 2012 that total
approximately $54.3 million which will expire in 2023 through 2031. The Company also has state tax
credit carryforwards of approximately $16.4 million that will expire beginning in 2020 through 2025.
The valuation allowance has been provided for state tax credit carryforwards and federal capital
losses. The 2011, 2010, and 2009 decreases of $2.2 million, $1.0 million and $1.7 million, respectively,
were recorded as a reduction in income tax expense. Based upon expected future income, management
believes that it is more likely than not that the results of operations will generate sufficient taxable
income to realize the deferred tax assets after giving consideration to the valuation allowance.
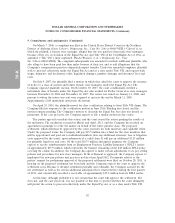
The Internal Revenue Service (‘‘IRS’’) is examining the Company’s federal income tax returns for
fiscal years 2006, 2007 and 2008. The 2005 and earlier years are not open for examination. The 2009,
2010, and 2011 fiscal years, while not currently under examination, are subject to examination at the
discretion of the IRS. The Company has various state income tax examinations that are currently in
progress. Generally, the Company’s tax years ended in 2008 and forward remain open for examination
by the various state taxing authorities.
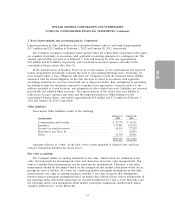
As of February 3, 2012, accruals for uncertain tax benefits, interest expense related to income taxes
and potential income tax penalties were $42.0 million, $1.2 million and $0.6 million, respectively, for a
total of $43.8 million. Of this amount, $0.3 million and $41.1 million are reflected in current liabilities
as Accrued expenses and other and in noncurrent Other liabilities, respectively, in the consolidated
balance sheet with the remaining $2.4 million reducing deferred tax assets related to net operating loss
carry forwards.
As of January 28, 2011, accruals for uncertain tax benefits, interest expense related to income taxes
and potential income tax penalties were $26.4 million, $1.9 million and $0.5 million, respectively, for a
total of $28.8 million. Of this amount, $0.2 million and $27.3 million are reflected in current liabilities
as Accrued expenses and other and in noncurrent Other liabilities, respectively, in the consolidated
balance sheet with the remaining $1.3 million reducing deferred tax assets related to net operating loss
carry forwards.
The Company believes that it is reasonably possible that the reserve for uncertain tax positions
may be reduced by approximately $30.4 million in the coming twelve months principally as a result of
the settlement of currently ongoing income tax examinations. The reasonably possible change of
$30.4 million is included in current liabilities in Accrued expenses and other ($0.2 million) and in
noncurrent Other liabilities ($30.2 million) in the consolidated balance sheet as of February 3, 2012.
Also, as of February 3, 2012, approximately $42.0 million of the uncertain tax positions would impact
72