Dollar General 2011 Annual Report Download - page 186
Download and view the complete annual report
Please find page 186 of the 2011 Dollar General annual report below. You can navigate through the pages in the report by either clicking on the pages listed below, or by using the keyword search tool below to find specific information within the annual report.-
 1
1 -
2
-
3
-
4
-
5
-
6
-
7
-
8
-
9
-
10
-
11
-
12
-
13
-
14
-
15
-
16
-
17
-
18
-
19
-
20
-
21
-
22
-
23
-
24
-
25
-
26
-
27
-
28
-
29
-
30
-
31
-
32
-
33
-
34
-
35
-
36
-
37
-
38
-
39
-
40
-
41
-
42
-
43
-
44
-
45
-
46
-
47
-
48
-
49
-
50
-
51
-
52
-
53
-
54
-
55
-
56
-
57
-
58
-
59
-
60
-
61
-
62
-
63
-
64
-
65
-
66
-
67
-
68
-
69
-
70
-
71
-
72
-
73
-
74
-
75
-
76
-
77
-
78
-
79
-
80
-
81
-
82
-
83
-
84
-
85
-
86
-
87
-
88
-
89
-
90
-
91
-
92
-
93
-
94
-
95
-
96
-
97
-
98
-
99
-
100
-
101
-
102
-
103
-
104
-
105
-
106
-
107
-
108
-
109
-
110
-
111
-
112
-
113
-
114
-
115
-
116
-
117
-
118
-
119
-
120
-
121
-
122
-
123
-
124
-
125
-
126
-
127
-
128
-
129
-
130
-
131
-
132
-
133
-
134
-
135
-
136
-
137
-
138
-
139
-
140
-
141
-
142
-
143
-
144
-
145
-
146
-
147
-
148
-
149
-
150
-
151
-
152
-
153
-
154
-
155
-
156
-
157
-
158
-
159
-
160
-
161
-
162
-
163
-
164
-
165
-
166
-
167
-
168
-
169
-
170
-
171
-
172
-
173
-
174
-
175
-
 176
176 -
 177
177 -
 178
178 -
 179
179 -
 180
180 -
 181
181 -
 182
182 -
 183
183 -
 184
184 -
 185
185 -
 186
186 -
 187
187 -
 188
188 -
 189
189 -
 190
190 -
 191
191 -
 192
192 -
 193
193 -
 194
194 -
 195
195 -
 196
196 -
197
-
198
-
199
-
200
-
201
-
202
-
203
-
204
-
205
-
206
-
207
-
208
-
209
-
210
-
211
-
212
-
213
-
214
-
215
-
216
-
217
-
218
-
219
-
220
 |
 |

10-K
DOLLAR GENERAL CORPORATION AND SUBSIDIARIES
NOTES TO CONSOLIDATED FINANCIAL STATEMENTS (Continued)
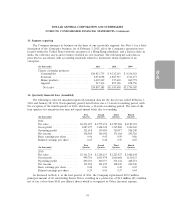
11. Share-based payments (Continued)
The weighted average for key assumptions used in determining the fair value of all options granted
in the years ended February 3, 2012, January 28, 2011, and January 29, 2010, and a summary of the
methodology applied to develop each assumption, are as follows:
February 3, January 28, January 29,
2012 2011 2010
Expected dividend yield ................... 0% 0% 0%
Expected stock price volatility .............. 38.7% 39.1% 41.2%
Weighted average risk-free interest rate ....... 2.3% 2.8% 2.8%
Expected term of options (years) ............ 6.8 7.0 7.4
Expected dividend yield—This is an estimate of the expected dividend yield on the Company’s
stock. The Company is subject to limitations on the payment of dividends under its Credit Facilities as
further discussed in Note 6. An increase in the dividend yield will decrease compensation expense.
Expected stock price volatility—This is a measure of the amount by which the price of the
Company’s common stock has fluctuated or is expected to fluctuate. For awards issued under the Plan
through October 2011, the expected volatilities were based upon the historical volatilities of a peer
group of four companies. Beginning in November 2011, the expected volatilities for awards are based
on the historical volatility of the Company’s publicly traded common stock. An increase in the expected
volatility will increase compensation expense.
Weighted average risk-free interest rate—This is the U.S. Treasury rate for the week of the grant
having a term approximating the expected life of the option. An increase in the risk-free interest rate
will increase compensation expense.
Expected term of options—This is the period of time over which the options granted are expected
to remain outstanding. Options granted have a maximum term of 10 years. Due to the relatively limited
historical data for grants issued under the Plan, the Company has estimated the expected term as the
mid-point between the vesting date and the contractual term of the option. An increase in the expected
term will increase compensation expense.
Both the Time Options and the Performance Options are subject to various provisions set forth in
a management stockholder’s agreement entered into with each option holder by which the Company
may require the employee, upon termination, to sell to the Company any vested options or shares
received upon exercise of the Time Options or Performance Options at amounts that differ based upon
the reason for the termination. In particular, in the event that the employee resigns ‘‘without good
reason’’ (as defined in the management stockholder’s agreement), then any options whether or not then
exercisable are forfeited and any shares received upon prior exercise of such options are callable at the
Company’s option at an amount equal to the lesser of fair value or the amount paid for the shares
(i.e., the exercise price). In such cases, because the employee would not benefit in any share
appreciation over the exercise price, for accounting purposes such options are not considered vested
until the expiration of the Company’s call option, which is generally five years subsequent to the date
of grant. Accordingly, all references to the vesting provisions or vested status of the options discussed
in this note give effect to the vesting pursuant to these accounting provisions and may differ from
descriptions of the vesting status of the Time Options and Performance Options located elsewhere in
this report or the Company’s other SEC filings. The Company records expense for Time Options on a
straight-line basis over the term of the management stockholder’s agreement.
86