Dollar General 2011 Annual Report Download - page 188
Download and view the complete annual report
Please find page 188 of the 2011 Dollar General annual report below. You can navigate through the pages in the report by either clicking on the pages listed below, or by using the keyword search tool below to find specific information within the annual report.-
 1
1 -
2
-
3
-
4
-
5
-
6
-
7
-
8
-
9
-
10
-
11
-
12
-
13
-
14
-
15
-
16
-
17
-
18
-
19
-
20
-
21
-
22
-
23
-
24
-
25
-
26
-
27
-
28
-
29
-
30
-
31
-
32
-
33
-
34
-
35
-
36
-
37
-
38
-
39
-
40
-
41
-
42
-
43
-
44
-
45
-
46
-
47
-
48
-
49
-
50
-
51
-
52
-
53
-
54
-
55
-
56
-
57
-
58
-
59
-
60
-
61
-
62
-
63
-
64
-
65
-
66
-
67
-
68
-
69
-
70
-
71
-
72
-
73
-
74
-
75
-
76
-
77
-
78
-
79
-
80
-
81
-
82
-
83
-
84
-
85
-
86
-
87
-
88
-
89
-
90
-
91
-
92
-
93
-
94
-
95
-
96
-
97
-
98
-
99
-
100
-
101
-
102
-
103
-
104
-
105
-
106
-
107
-
108
-
109
-
110
-
111
-
112
-
113
-
114
-
115
-
116
-
117
-
118
-
119
-
120
-
121
-
122
-
123
-
124
-
125
-
126
-
127
-
128
-
129
-
130
-
131
-
132
-
133
-
134
-
135
-
136
-
137
-
138
-
139
-
140
-
141
-
142
-
143
-
144
-
145
-
146
-
147
-
148
-
149
-
150
-
151
-
152
-
153
-
154
-
155
-
156
-
157
-
158
-
159
-
160
-
161
-
162
-
163
-
164
-
165
-
166
-
167
-
168
-
169
-
170
-
171
-
172
-
173
-
174
-
175
-
176
-
177
-
 178
178 -
 179
179 -
 180
180 -
 181
181 -
 182
182 -
 183
183 -
 184
184 -
 185
185 -
 186
186 -
 187
187 -
 188
188 -
 189
189 -
 190
190 -
 191
191 -
 192
192 -
 193
193 -
 194
194 -
 195
195 -
 196
196 -
 197
197 -
 198
198 -
199
-
200
-
201
-
202
-
203
-
204
-
205
-
206
-
207
-
208
-
209
-
210
-
211
-
212
-
213
-
214
-
215
-
216
-
217
-
218
-
219
-
220
 |
 |

10-K
DOLLAR GENERAL CORPORATION AND SUBSIDIARIES
NOTES TO CONSOLIDATED FINANCIAL STATEMENTS (Continued)
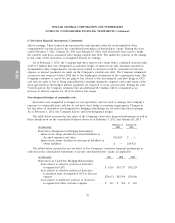
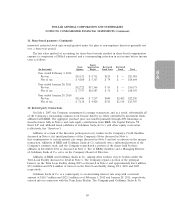
11. Share-based payments (Continued)
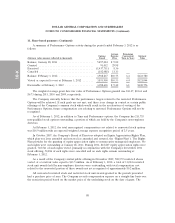
A summary of Performance Options activity during the period ended February 3, 2012 is as
follows:
Average Remaining
Options Exercise Contractual Intrinsic
(Intrinsic value amounts reflected in thousands) Issued Price Term in Years Value
Balance, January 28, 2011 ...................... 5,497,024 $ 9.82
Granted ................................... 91,012 29.98
Exercised .................................. (1,437,711) 8.36
Canceled ................................... (182,088) 11.13
Balance, February 3, 2012 ...................... 3,968,237 $10.75 6.4 $123,780
Vested or expected to vest at February 3, 2012 ....... 3,853,900 $10.53 6.4 $121,044
Exercisable at February 3, 2012 .................. 3,098,603 $ 9.42 6.1 $100,756
The weighted average grant date fair value of Performance Options granted was $13.47, $12.61 and
$6.73 during 2011, 2010 and 2009, respectively.
The Company currently believes that the performance targets related to the unvested Performance
Options will be achieved. If such goals are not met, and there is no change in control or certain public
offerings of the Company’s common stock which would result in the acceleration of vesting of the
Performance Options, future compensation cost relating to unvested Performance Options will not be
recognized.
As of February 3, 2012, in addition to Time and Performance options, the Company has 211,755
non-qualified stock options outstanding, a portion of which are held by the Company’s non-employee
directors.
At February 3, 2012, the total unrecognized compensation cost related to nonvested stock options
was $16.9 million with an expected weighted average expense recognition period of 2.5 years.
In October 2007, the Company’s Board of Directors adopted an Equity Appreciation Rights Plan,
which plan was later amended and restated (as amended and restated, the ‘‘Rights Plan’’). The Rights
Plan provides for the granting of equity appreciation rights to nonexecutive managerial employees. No
such rights were outstanding at January 28, 2011. During 2011, 818,847 equity appreciation rights were
granted, 768,561 of such rights vested, primarily in conjunction with the Company’s December 2011
stock offering, 50,286 of such rights were cancelled and no such rights remain outstanding at
February 3, 2012.
As a result of the Company’s initial public offering in November 2009, 508,572 restricted shares
vested, at a total fair value equal to $11.5 million. As of February 3, 2012, a total of 13,024 restricted
stock unit awards held by non-employee directors were outstanding, with total compensation cost
related to the nonvested portion of these awards not yet recognized of approximately $0.2 million.
All nonvested restricted stock and restricted stock unit awards granted in the periods presented
had a purchase price of zero. The Company records compensation expense on a straight-line basis over
the restriction period based on the market price of the underlying stock on the date of grant. The
88