Dollar General 2011 Annual Report Download - page 199
Download and view the complete annual report
Please find page 199 of the 2011 Dollar General annual report below. You can navigate through the pages in the report by either clicking on the pages listed below, or by using the keyword search tool below to find specific information within the annual report.-
 1
1 -
2
-
3
-
4
-
5
-
6
-
7
-
8
-
9
-
10
-
11
-
12
-
13
-
14
-
15
-
16
-
17
-
18
-
19
-
20
-
21
-
22
-
23
-
24
-
25
-
26
-
27
-
28
-
29
-
30
-
31
-
32
-
33
-
34
-
35
-
36
-
37
-
38
-
39
-
40
-
41
-
42
-
43
-
44
-
45
-
46
-
47
-
48
-
49
-
50
-
51
-
52
-
53
-
54
-
55
-
56
-
57
-
58
-
59
-
60
-
61
-
62
-
63
-
64
-
65
-
66
-
67
-
68
-
69
-
70
-
71
-
72
-
73
-
74
-
75
-
76
-
77
-
78
-
79
-
80
-
81
-
82
-
83
-
84
-
85
-
86
-
87
-
88
-
89
-
90
-
91
-
92
-
93
-
94
-
95
-
96
-
97
-
98
-
99
-
100
-
101
-
102
-
103
-
104
-
105
-
106
-
107
-
108
-
109
-
110
-
111
-
112
-
113
-
114
-
115
-
116
-
117
-
118
-
119
-
120
-
121
-
122
-
123
-
124
-
125
-
126
-
127
-
128
-
129
-
130
-
131
-
132
-
133
-
134
-
135
-
136
-
137
-
138
-
139
-
140
-
141
-
142
-
143
-
144
-
145
-
146
-
147
-
148
-
149
-
150
-
151
-
152
-
153
-
154
-
155
-
156
-
157
-
158
-
159
-
160
-
161
-
162
-
163
-
164
-
165
-
166
-
167
-
168
-
169
-
170
-
171
-
172
-
173
-
174
-
175
-
176
-
177
-
178
-
179
-
180
-
181
-
182
-
183
-
184
-
185
-
186
-
187
-
188
-
 189
189 -
 190
190 -
 191
191 -
 192
192 -
 193
193 -
 194
194 -
 195
195 -
 196
196 -
 197
197 -
 198
198 -
 199
199 -
 200
200 -
 201
201 -
 202
202 -
 203
203 -
 204
204 -
 205
205 -
 206
206 -
 207
207 -
 208
208 -
 209
209 -
210
-
211
-
212
-
213
-
214
-
215
-
216
-
217
-
218
-
219
-
220
 |
 |

10-K
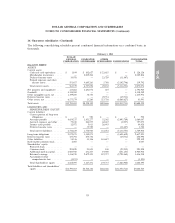
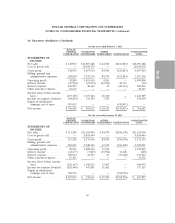
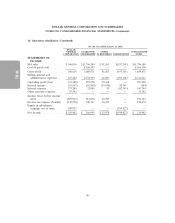
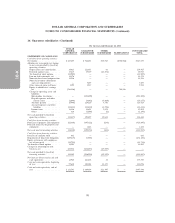
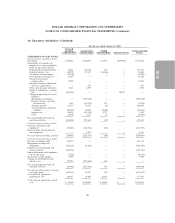
DOLLAR GENERAL CORPORATION AND SUBSIDIARIES
NOTES TO CONSOLIDATED FINANCIAL STATEMENTS (Continued)
16. Guarantor subsidiaries (Continued)
For the year ended January 29, 2010
DOLLAR
GENERAL GUARANTOR OTHER CONSOLIDATED
CORPORATION SUBSIDIARIES SUBSIDIARIES ELIMINATIONS TOTAL
STATEMENTS OF CASH FLOWS:
Cash flows from operating activities:
Net income ............... $339,442 $ 566,949 $ 32,978 $(599,927) $ 339,442
Adjustments to reconcile net
income to net cash provided by
(used in) operating activities:
Depreciation and amortization . . 36,541 220,048 182 — 256,771
Deferred income taxes ....... (18,571) 67,317 (33,886) — 14,860
Tax benefit of stock options .... (5,390) — — — (5,390)
Loss on debt retirement, net . . . 55,265 — — — 55,265
Noncash share-based
compensation ........... 17,295 — — — 17,295
Noncash inventory adjustments
and asset impairments ..... — 647 — — 647
Other noncash gains and losses . 3,221 4,699 — — 7,920
Equity in subsidiaries’ earnings,
net ................. (599,927) — — 599,927 —
Change in operating assets and
liabilities:
Merchandise inventories .... — (100,248) — — (100,248)
Prepaid expenses and other
current assets ......... 2,582 (10,252) 372 — (7,298)
Accounts payable ........ 26,535 79,515 (1) — 106,049
Accrued expenses and other
liabilities ............ (20,672) 10,494 (2,465) — (12,643)
Income taxes ........... 48,494 (50,112) 2,771 — 1,153
Other ............... (3,203) 2,171 32 — (1,000)
Net cash provided by (used in)
operating activities ......... (118,388) 791,228 (17) — 672,823
Cash flows from investing activities:
Purchases of property and
equipment .............. (34,647) (216,032) (68) — (250,747)
Proceeds from sales of property
and equipment ........... — 2,701 — — 2,701
Net cash used in investing activities (34,647) (213,331) (68) — (248,046)
Cash flows from financing activities:
Issuance of common stock ...... 443,753 — — — 443,753
Repayments of long-term
obligations .............. (782,518) (1,662) — — (784,180)
Payment of cash dividends and
related amounts ........... (239,731) — — — (239,731)
Equity settlements with employees,
net of taxes paid .......... (5,928) — — — (5,928)
Tax benefit of stock options ..... 5,390 — — — 5,390
Changes in intercompany note
balances, net ............. 537,052 (537,638) 586 — —
Net cash provided by (used in)
financing activities ......... (41,982) (539,300) 586 — (580,696)
Net increase (decrease) in cash and
cash equivalents ........... (195,017) 38,597 501 — (155,919)
Cash and cash equivalents,
beginning of year .......... 292,637 64,404 20,954 — 377,995
Cash and cash equivalents, end of
year .................. $ 97,620 $ 103,001 $ 21,455 $ — $ 222,076
99