Dollar General 2011 Annual Report Download - page 133
Download and view the complete annual report
Please find page 133 of the 2011 Dollar General annual report below. You can navigate through the pages in the report by either clicking on the pages listed below, or by using the keyword search tool below to find specific information within the annual report.-
 1
1 -
2
-
3
-
4
-
5
-
6
-
7
-
8
-
9
-
10
-
11
-
12
-
13
-
14
-
15
-
16
-
17
-
18
-
19
-
20
-
21
-
22
-
23
-
24
-
25
-
26
-
27
-
28
-
29
-
30
-
31
-
32
-
33
-
34
-
35
-
36
-
37
-
38
-
39
-
40
-
41
-
42
-
43
-
44
-
45
-
46
-
47
-
48
-
49
-
50
-
51
-
52
-
53
-
54
-
55
-
56
-
57
-
58
-
59
-
60
-
61
-
62
-
63
-
64
-
65
-
66
-
67
-
68
-
69
-
70
-
71
-
72
-
73
-
74
-
75
-
76
-
77
-
78
-
79
-
80
-
81
-
82
-
83
-
84
-
85
-
86
-
87
-
88
-
89
-
90
-
91
-
92
-
93
-
94
-
95
-
96
-
97
-
98
-
99
-
100
-
101
-
102
-
103
-
104
-
105
-
106
-
107
-
108
-
109
-
110
-
111
-
112
-
113
-
114
-
115
-
116
-
117
-
118
-
119
-
120
-
121
-
122
-
 123
123 -
 124
124 -
 125
125 -
 126
126 -
 127
127 -
 128
128 -
 129
129 -
 130
130 -
 131
131 -
 132
132 -
 133
133 -
 134
134 -
 135
135 -
 136
136 -
 137
137 -
 138
138 -
 139
139 -
 140
140 -
 141
141 -
 142
142 -
 143
143 -
144
-
145
-
146
-
147
-
148
-
149
-
150
-
151
-
152
-
153
-
154
-
155
-
156
-
157
-
158
-
159
-
160
-
161
-
162
-
163
-
164
-
165
-
166
-
167
-
168
-
169
-
170
-
171
-
172
-
173
-
174
-
175
-
176
-
177
-
178
-
179
-
180
-
181
-
182
-
183
-
184
-
185
-
186
-
187
-
188
-
189
-
190
-
191
-
192
-
193
-
194
-
195
-
196
-
197
-
198
-
199
-
200
-
201
-
202
-
203
-
204
-
205
-
206
-
207
-
208
-
209
-
210
-
211
-
212
-
213
-
214
-
215
-
216
-
217
-
218
-
219
-
220
 |
 |

10-K
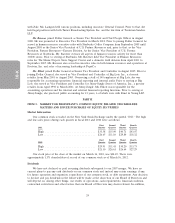
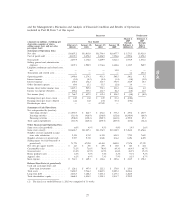
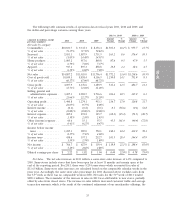
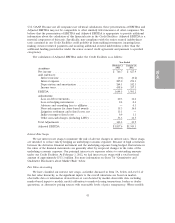
The following table contains results of operations data for fiscal years 2011, 2010 and 2009, and
the dollar and percentage variances among those years.
2011 vs. 2010 2010 vs. 2009
Amount % Amount %
(amounts in millions, except 2011 2010 2009 Change Change Change Change
per share amounts)
Net sales by category:
Consumables .......... $10,833.7 $ 9,332.1 $ 8,356.4 $1,501.6 16.1% $975.7 11.7%
% of net sales ......... 73.17% 71.59% 70.84%
Seasonal ............. 2,051.1 1,887.9 1,711.5 163.2 8.6 176.4 10.3
% of net sales ......... 13.85% 14.48% 14.51%
Home products ........ 1,005.2 917.6 869.8 87.6 9.5 47.9 5.5
% of net sales ......... 6.79% 7.04% 7.37%
Apparel .............. 917.1 897.3 858.8 19.8 2.2 38.6 4.5
% of net sales ......... 6.19% 6.88% 7.28%
Net sales ............. $14,807.2 $13,035.0 $11,796.4 $1,772.2 13.6% $1,238.6 10.5%
Cost of goods sold ...... 10,109.3 8,858.4 8,106.5 1,250.8 14.1 751.9 9.3
% of net sales ......... 68.27% 67.96% 68.72%
Gross profit ........... 4,697.9 4,176.6 3,689.9 521.4 12.5 486.7 13.2
% of net sales ......... 31.73% 32.04% 31.28%
Selling, general and
administrative expenses . 3,207.1 2,902.5 2,736.6 304.6 10.5 165.9 6.1
% of net sales ......... 21.66% 22.27% 23.20%
Operating profit ........ 1,490.8 1,274.1 953.3 216.7 17.0 320.8 33.7
% of net sales ......... 10.07% 9.77% 8.08%
Interest income ........ (0.1) (0.2) (0.1) 0.1 (58.6) (0.1) 52.8
% of net sales ......... (0.00)% (0.00)% (0.00)%
Interest expense ........ 205.0 274.2 345.7 (69.2) (25.2) (71.5) (20.7)
% of net sales ......... 1.38% 2.10% 2.93%
Other (income) expense . . 60.6 15.1 55.5 45.5 301.4 (40.4) (72.8)
% of net sales ......... 0.41% 0.12% 0.47%
Income before income
taxes .............. 1,225.3 985.0 552.1 240.3 24.4 432.9 78.4
% of net sales ......... 8.27% 7.56% 4.68%
Income taxes .......... 458.6 357.1 212.7 101.5 28.4 144.4 67.9
% of net sales ......... 3.10% 2.74% 1.80%
Net income ........... $ 766.7 $ 627.9 $ 339.4 $ 138.8 22.1% $288.4 85.0%
% of net sales ......... 5.18% 4.82% 2.88%
Diluted earnings per share $ 2.22 $ 1.82 $ 1.04 $ 0.40 22.0% $0.78 75.0%
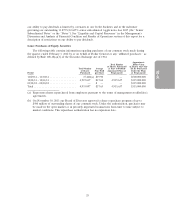
Net Sales. The net sales increase in 2011 reflects a same-store sales increase of 6.0% compared to
2010. Same-stores include stores that have been open for at least 13 months and remain open at the
end of the reporting period. For 2011, there were 9,254 same-stores which accounted for sales of
$13.63 billion. Same-store sales increases are calculated based on the comparable calendar weeks in the
prior year. Accordingly, the same store sales percentage for 2011 discussed above excludes sales from
the 53rd week as there was no comparable week in 2010. Net sales for the 53rd week of 2011 totaled
$289.3 million. The remainder of the increase in sales in 2011 was attributable to new stores, partially
offset by sales from closed stores. The increase in sales reflects increased customer traffic and average
transaction amounts, which is the result of the continued refinement of our merchandise offerings, the
33