Dollar General 2011 Annual Report Download - page 178
Download and view the complete annual report
Please find page 178 of the 2011 Dollar General annual report below. You can navigate through the pages in the report by either clicking on the pages listed below, or by using the keyword search tool below to find specific information within the annual report.-
 1
1 -
2
-
3
-
4
-
5
-
6
-
7
-
8
-
9
-
10
-
11
-
12
-
13
-
14
-
15
-
16
-
17
-
18
-
19
-
20
-
21
-
22
-
23
-
24
-
25
-
26
-
27
-
28
-
29
-
30
-
31
-
32
-
33
-
34
-
35
-
36
-
37
-
38
-
39
-
40
-
41
-
42
-
43
-
44
-
45
-
46
-
47
-
48
-
49
-
50
-
51
-
52
-
53
-
54
-
55
-
56
-
57
-
58
-
59
-
60
-
61
-
62
-
63
-
64
-
65
-
66
-
67
-
68
-
69
-
70
-
71
-
72
-
73
-
74
-
75
-
76
-
77
-
78
-
79
-
80
-
81
-
82
-
83
-
84
-
85
-
86
-
87
-
88
-
89
-
90
-
91
-
92
-
93
-
94
-
95
-
96
-
97
-
98
-
99
-
100
-
101
-
102
-
103
-
104
-
105
-
106
-
107
-
108
-
109
-
110
-
111
-
112
-
113
-
114
-
115
-
116
-
117
-
118
-
119
-
120
-
121
-
122
-
123
-
124
-
125
-
126
-
127
-
128
-
129
-
130
-
131
-
132
-
133
-
134
-
135
-
136
-
137
-
138
-
139
-
140
-
141
-
142
-
143
-
144
-
145
-
146
-
147
-
148
-
149
-
150
-
151
-
152
-
153
-
154
-
155
-
156
-
157
-
158
-
159
-
160
-
161
-
162
-
163
-
164
-
165
-
166
-
167
-
 168
168 -
 169
169 -
 170
170 -
 171
171 -
 172
172 -
 173
173 -
 174
174 -
 175
175 -
 176
176 -
 177
177 -
 178
178 -
 179
179 -
 180
180 -
 181
181 -
 182
182 -
 183
183 -
 184
184 -
 185
185 -
 186
186 -
 187
187 -
 188
188 -
189
-
190
-
191
-
192
-
193
-
194
-
195
-
196
-
197
-
198
-
199
-
200
-
201
-
202
-
203
-
204
-
205
-
206
-
207
-
208
-
209
-
210
-
211
-
212
-
213
-
214
-
215
-
216
-
217
-
218
-
219
-
220
 |
 |

10-K
DOLLAR GENERAL CORPORATION AND SUBSIDIARIES
NOTES TO CONSOLIDATED FINANCIAL STATEMENTS (Continued)
8. Derivative financial instruments (Continued)
affects earnings. These transactions represent the only amounts reflected in Accumulated other
comprehensive income (loss) in the consolidated statements of shareholders’ equity. During the years
ended February 3, 2012, January 28, 2011 and January 29, 2010, such derivatives were used to hedge
the variable cash flows associated with existing variable-rate debt. The ineffective portion of the change
in fair value of the derivatives is recognized directly in earnings.
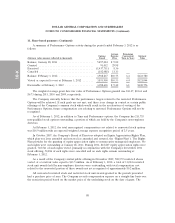
As of February 3, 2012, the Company had three interest rate swaps with a combined notional value
of $533.3 million that were designated as cash flow hedges of interest rate risk. Amounts reported in
Accumulated other comprehensive income (loss) related to derivatives will be reclassified to interest
expense as interest payments are made on the Company’s variable-rate debt. The Company terminated
an interest rate swap in October 2008 due to the bankruptcy declaration of the counterparty bank. The
Company continues to report the net gain or loss related to the discontinued cash flow hedge in OCI
and such net gain or loss is being reclassified into earnings during the original contractual terms of the
swap agreement as the hedged interest payments are expected to occur as forecasted. During the next
52-week period, the Company estimates that an additional $8.5 million will be reclassified as an
increase to interest expense for all of its interest rate swaps.
Non-designated hedges of commodity risk
Derivatives not designated as hedges are not speculative and are used to manage the Company’s
exposure to commodity price risk but do not meet strict hedge accounting requirements. Changes in
the fair value of derivatives not designated in hedging relationships are recorded directly in earnings.
As of February 3, 2012, the Company had no such non-designated hedges.
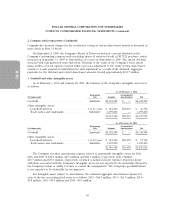
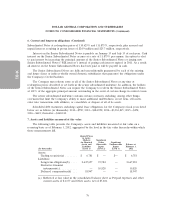
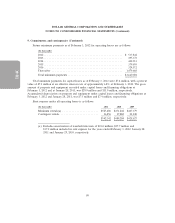
The table below presents the fair value of the Company’s derivative financial instruments as well as
their classification on the consolidated balance sheets as of February 3, 2012 and January 28, 2011:
February 3, January 28,
(in thousands) 2012 2011
Derivatives Designated as Hedging Instruments
Interest rate swaps classified in current liabilities as
Accrued expenses and other ..................... $10,820 $ —
Interest rate swaps classified in noncurrent liabilities as
Other liabilities .............................. $ — $34,923
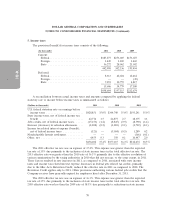
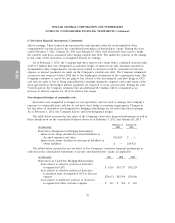
The tables below present the pre-tax effect of the Company’s derivative financial instruments as
reflected in the consolidated statements of income and shareholders’ equity, as applicable:
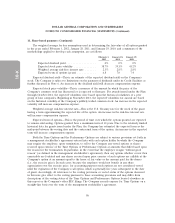
(in thousands) 2011 2010 2009
Derivatives in Cash Flow Hedging Relationships
Loss related to effective portion of derivative
recognized in OCI ....................... $ 3,836 $19,717 $42,324
Loss related to effective portion of derivative
reclassified from Accumulated OCI to Interest
expense ............................... $28,633 $42,994 $50,140
Loss related to ineffective portion of derivative
recognized in Other (income) expense ......... $ 312 $ 526 $ 618
78