Dollar General 2011 Annual Report Download - page 194
Download and view the complete annual report
Please find page 194 of the 2011 Dollar General annual report below. You can navigate through the pages in the report by either clicking on the pages listed below, or by using the keyword search tool below to find specific information within the annual report.-
 1
1 -
2
-
3
-
4
-
5
-
6
-
7
-
8
-
9
-
10
-
11
-
12
-
13
-
14
-
15
-
16
-
17
-
18
-
19
-
20
-
21
-
22
-
23
-
24
-
25
-
26
-
27
-
28
-
29
-
30
-
31
-
32
-
33
-
34
-
35
-
36
-
37
-
38
-
39
-
40
-
41
-
42
-
43
-
44
-
45
-
46
-
47
-
48
-
49
-
50
-
51
-
52
-
53
-
54
-
55
-
56
-
57
-
58
-
59
-
60
-
61
-
62
-
63
-
64
-
65
-
66
-
67
-
68
-
69
-
70
-
71
-
72
-
73
-
74
-
75
-
76
-
77
-
78
-
79
-
80
-
81
-
82
-
83
-
84
-
85
-
86
-
87
-
88
-
89
-
90
-
91
-
92
-
93
-
94
-
95
-
96
-
97
-
98
-
99
-
100
-
101
-
102
-
103
-
104
-
105
-
106
-
107
-
108
-
109
-
110
-
111
-
112
-
113
-
114
-
115
-
116
-
117
-
118
-
119
-
120
-
121
-
122
-
123
-
124
-
125
-
126
-
127
-
128
-
129
-
130
-
131
-
132
-
133
-
134
-
135
-
136
-
137
-
138
-
139
-
140
-
141
-
142
-
143
-
144
-
145
-
146
-
147
-
148
-
149
-
150
-
151
-
152
-
153
-
154
-
155
-
156
-
157
-
158
-
159
-
160
-
161
-
162
-
163
-
164
-
165
-
166
-
167
-
168
-
169
-
170
-
171
-
172
-
173
-
174
-
175
-
176
-
177
-
178
-
179
-
180
-
181
-
182
-
183
-
 184
184 -
 185
185 -
 186
186 -
 187
187 -
 188
188 -
 189
189 -
 190
190 -
 191
191 -
 192
192 -
 193
193 -
 194
194 -
 195
195 -
 196
196 -
 197
197 -
 198
198 -
 199
199 -
 200
200 -
 201
201 -
 202
202 -
 203
203 -
 204
204 -
205
-
206
-
207
-
208
-
209
-
210
-
211
-
212
-
213
-
214
-
215
-
216
-
217
-
218
-
219
-
220
 |
 |

10-K
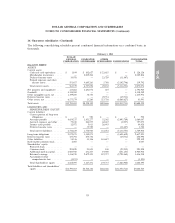
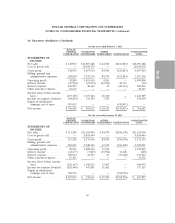
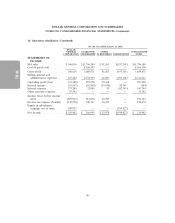
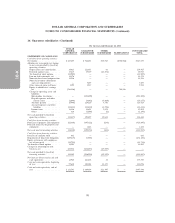
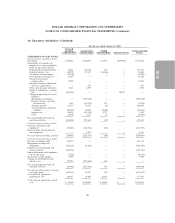
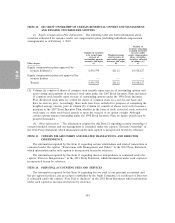
DOLLAR GENERAL CORPORATION AND SUBSIDIARIES
NOTES TO CONSOLIDATED FINANCIAL STATEMENTS (Continued)
16. Guarantor subsidiaries (Continued)
January 28, 2011
DOLLAR
GENERAL GUARANTOR OTHER CONSOLIDATED
CORPORATION SUBSIDIARIES SUBSIDIARIES ELIMINATIONS TOTAL
BALANCE SHEET:
ASSETS
Current assets:
Cash and cash equivalents .... $ 111,545 $ 364,404 $ 21,497 $ — $ 497,446
Merchandise inventories ..... — 1,765,433 — — 1,765,433
Income taxes receivable ...... 13,529 — — (13,529) —
Deferred income taxes ...... 8,877 — 6,825 (15,702) —
Prepaid expenses and other
current assets ........... 741,352 3,698,117 4,454 (4,338,977) 104,946
Total current assets ......... 875,303 5,827,954 32,776 (4,368,208) 2,367,825
Net property and equipment .... 105,155 1,419,133 287 — 1,524,575
Goodwill ................. 4,338,589 — — — 4,338,589
Other intangible assets, net ..... 1,199,200 57,722 — — 1,256,922
Deferred income taxes ........ — — 47,690 (47,690) —
Other assets, net ............ 5,337,522 12,675 304,285 (5,596,171) 58,311
Total assets ............... $11,855,769 $7,317,484 $385,038 $(10,012,069) $9,546,222
LIABILITIES AND
SHAREHOLDERS’ EQUITY
Current liabilities:
Current portion of long-term
obligations ............. $ — $ 1,157 $ — $ — $ 1,157
Accounts payable .......... 3,691,564 1,541,593 50,824 (4,330,340) 953,641
Accrued expenses and other . . . 68,398 226,225 61,755 (8,637) 347,741
Income taxes payable ....... 11,922 13,246 14,341 (13,529) 25,980
Deferred income taxes ...... — 52,556 — (15,702) 36,854
Total current liabilities ....... 3,771,884 1,834,777 126,920 (4,368,208) 1,365,373
Long-term obligations ........ 3,534,447 3,000,877 — (3,248,254) 3,287,070
Deferred income taxes ........ 417,874 228,381 — (47,690) 598,565
Other liabilities ............. 67,932 27,250 136,400 — 231,582
Redeemable common stock ..... 9,153 — — — 9,153
Shareholders’ equity:
Preferred stock ........... — — — — —
Common stock ........... 298,819 23,855 100 (23,955) 298,819
Additional paid-in capital ..... 2,945,024 431,253 19,900 (451,153) 2,945,024
Retained earnings ......... 830,932 1,771,091 101,718 (1,872,809) 830,932
Accumulated other
comprehensive loss ....... (20,296) — — — (20,296)
Total shareholders’ equity .... 4,054,479 2,226,199 121,718 (2,347,917) 4,054,479
Total liabilities and shareholders’
equity ................. $11,855,769 $7,317,484 $385,038 $(10,012,069) $9,546,222
94