Dollar General 2011 Annual Report Download - page 163
Download and view the complete annual report
Please find page 163 of the 2011 Dollar General annual report below. You can navigate through the pages in the report by either clicking on the pages listed below, or by using the keyword search tool below to find specific information within the annual report.-
 1
1 -
2
-
3
-
4
-
5
-
6
-
7
-
8
-
9
-
10
-
11
-
12
-
13
-
14
-
15
-
16
-
17
-
18
-
19
-
20
-
21
-
22
-
23
-
24
-
25
-
26
-
27
-
28
-
29
-
30
-
31
-
32
-
33
-
34
-
35
-
36
-
37
-
38
-
39
-
40
-
41
-
42
-
43
-
44
-
45
-
46
-
47
-
48
-
49
-
50
-
51
-
52
-
53
-
54
-
55
-
56
-
57
-
58
-
59
-
60
-
61
-
62
-
63
-
64
-
65
-
66
-
67
-
68
-
69
-
70
-
71
-
72
-
73
-
74
-
75
-
76
-
77
-
78
-
79
-
80
-
81
-
82
-
83
-
84
-
85
-
86
-
87
-
88
-
89
-
90
-
91
-
92
-
93
-
94
-
95
-
96
-
97
-
98
-
99
-
100
-
101
-
102
-
103
-
104
-
105
-
106
-
107
-
108
-
109
-
110
-
111
-
112
-
113
-
114
-
115
-
116
-
117
-
118
-
119
-
120
-
121
-
122
-
123
-
124
-
125
-
126
-
127
-
128
-
129
-
130
-
131
-
132
-
133
-
134
-
135
-
136
-
137
-
138
-
139
-
140
-
141
-
142
-
143
-
144
-
145
-
146
-
147
-
148
-
149
-
150
-
151
-
152
-
 153
153 -
 154
154 -
 155
155 -
 156
156 -
 157
157 -
 158
158 -
 159
159 -
 160
160 -
 161
161 -
 162
162 -
 163
163 -
 164
164 -
 165
165 -
 166
166 -
 167
167 -
 168
168 -
 169
169 -
 170
170 -
 171
171 -
 172
172 -
 173
173 -
174
-
175
-
176
-
177
-
178
-
179
-
180
-
181
-
182
-
183
-
184
-
185
-
186
-
187
-
188
-
189
-
190
-
191
-
192
-
193
-
194
-
195
-
196
-
197
-
198
-
199
-
200
-
201
-
202
-
203
-
204
-
205
-
206
-
207
-
208
-
209
-
210
-
211
-
212
-
213
-
214
-
215
-
216
-
217
-
218
-
219
-
220
 |
 |

10-K
DOLLAR GENERAL CORPORATION AND SUBSIDIARIES
NOTES TO CONSOLIDATED FINANCIAL STATEMENTS (Continued)
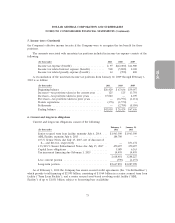
1. Basis of presentation and accounting policies (Continued)
long-term portion in Other liabilities in the consolidated balance sheets, and totaled approximately
$31.3 million and $23.2 million at February 3, 2012 and January 28, 2011, respectively.
The Company recognizes contingent rental expense when the achievement of specified sales targets
are considered probable, in accordance with applicable accounting standards for contingent rent. The
amount expensed but not paid as of February 3, 2012 and January 28, 2011 was approximately
$9.4 million and $9.2 million, respectively, and is included in Accrued expenses and other in the
consolidated balance sheets (See Note 9).
In the normal course of business, based on an overall analysis of store performance and expected
trends, management periodically evaluates the need to close underperforming stores. Generally, for
store closures where a lease obligation still exists, the Company records the estimated future liability
associated with the rental obligation on the date the store is closed in accordance with applicable
accounting standards for costs associated with exit or disposal activities. Key assumptions in calculating
the liability include the timeframe expected to terminate lease agreements, estimates related to the
sublease potential of closed locations, and estimation of other related exit costs. Liabilities are reviewed
periodically and adjusted when necessary. The current portion of the closed store rent liability is
reflected in Accrued expenses and other and the long-term portion in Other liabilities in the
consolidated balance sheets, and totaled approximately $4.9 million and $7.0 million at February 3,
2012 and January 28, 2011, respectively.
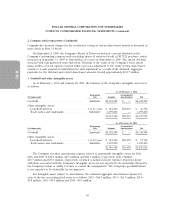
Other liabilities
Non-current Other liabilities consist of the following:
February 3, January 28,
(In thousands) 2012 2011
Compensation and benefits ......................... $ 17,570 $ 14,531
Insurance ...................................... 137,891 131,912
Income tax related reserves ......................... 41,130 27,255
Derivatives (see Note 8) ........................... — 34,923
Other ......................................... 32,558 22,961
$229,149 $231,582
Amounts reflected as ‘‘other’’ in the table above consist primarily of deferred rent and lease
contract termination liabilities for closed stores.
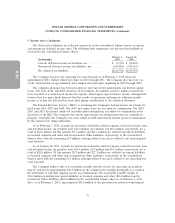
Fair value accounting
The Company utilizes accounting standards for fair value, which include the definition of fair
value, the framework for measuring fair value, and disclosures about fair value measurements. Fair
value is a market-based measurement, not an entity-specific measurement. Therefore, a fair value
measurement should be determined based on the assumptions that market participants would use in
pricing the asset or liability. As a basis for considering market participant assumptions in fair value
measurements, fair value accounting standards establish a fair value hierarchy that distinguishes
between market participant assumptions based on market data obtained from sources independent of
the reporting entity (observable inputs that are classified within Levels 1 and 2 of the hierarchy) and
the reporting entity’s own assumptions about market participant assumptions (unobservable inputs
classified within Level 3 of the hierarchy).
63