Dollar General 2011 Annual Report Download - page 155
Download and view the complete annual report
Please find page 155 of the 2011 Dollar General annual report below. You can navigate through the pages in the report by either clicking on the pages listed below, or by using the keyword search tool below to find specific information within the annual report.-
 1
1 -
2
-
3
-
4
-
5
-
6
-
7
-
8
-
9
-
10
-
11
-
12
-
13
-
14
-
15
-
16
-
17
-
18
-
19
-
20
-
21
-
22
-
23
-
24
-
25
-
26
-
27
-
28
-
29
-
30
-
31
-
32
-
33
-
34
-
35
-
36
-
37
-
38
-
39
-
40
-
41
-
42
-
43
-
44
-
45
-
46
-
47
-
48
-
49
-
50
-
51
-
52
-
53
-
54
-
55
-
56
-
57
-
58
-
59
-
60
-
61
-
62
-
63
-
64
-
65
-
66
-
67
-
68
-
69
-
70
-
71
-
72
-
73
-
74
-
75
-
76
-
77
-
78
-
79
-
80
-
81
-
82
-
83
-
84
-
85
-
86
-
87
-
88
-
89
-
90
-
91
-
92
-
93
-
94
-
95
-
96
-
97
-
98
-
99
-
100
-
101
-
102
-
103
-
104
-
105
-
106
-
107
-
108
-
109
-
110
-
111
-
112
-
113
-
114
-
115
-
116
-
117
-
118
-
119
-
120
-
121
-
122
-
123
-
124
-
125
-
126
-
127
-
128
-
129
-
130
-
131
-
132
-
133
-
134
-
135
-
136
-
137
-
138
-
139
-
140
-
141
-
142
-
143
-
144
-
 145
145 -
 146
146 -
 147
147 -
 148
148 -
 149
149 -
 150
150 -
 151
151 -
 152
152 -
 153
153 -
 154
154 -
 155
155 -
 156
156 -
 157
157 -
 158
158 -
 159
159 -
 160
160 -
 161
161 -
 162
162 -
 163
163 -
 164
164 -
 165
165 -
166
-
167
-
168
-
169
-
170
-
171
-
172
-
173
-
174
-
175
-
176
-
177
-
178
-
179
-
180
-
181
-
182
-
183
-
184
-
185
-
186
-
187
-
188
-
189
-
190
-
191
-
192
-
193
-
194
-
195
-
196
-
197
-
198
-
199
-
200
-
201
-
202
-
203
-
204
-
205
-
206
-
207
-
208
-
209
-
210
-
211
-
212
-
213
-
214
-
215
-
216
-
217
-
218
-
219
-
220
 |
 |

10-K
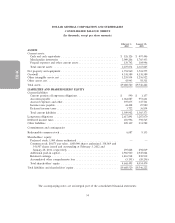
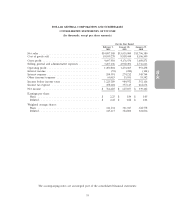
DOLLAR GENERAL CORPORATION AND SUBSIDIARIES
CONSOLIDATED STATEMENTS OF INCOME
(In thousands, except per share amounts)
For the Year Ended
February 3, January 28, January 29,
2012 2011 2010
Net sales ...................................... $14,807,188 $13,035,000 $11,796,380
Cost of goods sold ............................... 10,109,278 8,858,444 8,106,509
Gross profit .................................... 4,697,910 4,176,556 3,689,871
Selling, general and administrative expenses ............. 3,207,106 2,902,491 2,736,613
Operating profit ................................. 1,490,804 1,274,065 953,258
Interest income ................................. (91) (220) (144)
Interest expense ................................. 204,991 274,212 345,744
Other (income) expense ........................... 60,615 15,101 55,542
Income before income taxes ........................ 1,225,289 984,972 552,116
Income tax expense .............................. 458,604 357,115 212,674
Net income .................................... $ 766,685 $ 627,857 $ 339,442
Earnings per share:
Basic ....................................... $ 2.25 $ 1.84 $ 1.05
Diluted ...................................... $ 2.22 $ 1.82 $ 1.04
Weighted average shares:
Basic ....................................... 341,234 341,047 322,778
Diluted ...................................... 345,117 344,800 324,836
The accompanying notes are an integral part of the consolidated financial statements.
55