Dollar General 2011 Annual Report Download - page 170
Download and view the complete annual report
Please find page 170 of the 2011 Dollar General annual report below. You can navigate through the pages in the report by either clicking on the pages listed below, or by using the keyword search tool below to find specific information within the annual report.-
 1
1 -
2
-
3
-
4
-
5
-
6
-
7
-
8
-
9
-
10
-
11
-
12
-
13
-
14
-
15
-
16
-
17
-
18
-
19
-
20
-
21
-
22
-
23
-
24
-
25
-
26
-
27
-
28
-
29
-
30
-
31
-
32
-
33
-
34
-
35
-
36
-
37
-
38
-
39
-
40
-
41
-
42
-
43
-
44
-
45
-
46
-
47
-
48
-
49
-
50
-
51
-
52
-
53
-
54
-
55
-
56
-
57
-
58
-
59
-
60
-
61
-
62
-
63
-
64
-
65
-
66
-
67
-
68
-
69
-
70
-
71
-
72
-
73
-
74
-
75
-
76
-
77
-
78
-
79
-
80
-
81
-
82
-
83
-
84
-
85
-
86
-
87
-
88
-
89
-
90
-
91
-
92
-
93
-
94
-
95
-
96
-
97
-
98
-
99
-
100
-
101
-
102
-
103
-
104
-
105
-
106
-
107
-
108
-
109
-
110
-
111
-
112
-
113
-
114
-
115
-
116
-
117
-
118
-
119
-
120
-
121
-
122
-
123
-
124
-
125
-
126
-
127
-
128
-
129
-
130
-
131
-
132
-
133
-
134
-
135
-
136
-
137
-
138
-
139
-
140
-
141
-
142
-
143
-
144
-
145
-
146
-
147
-
148
-
149
-
150
-
151
-
152
-
153
-
154
-
155
-
156
-
157
-
158
-
159
-
 160
160 -
 161
161 -
 162
162 -
 163
163 -
 164
164 -
 165
165 -
 166
166 -
 167
167 -
 168
168 -
 169
169 -
 170
170 -
 171
171 -
 172
172 -
 173
173 -
 174
174 -
 175
175 -
 176
176 -
 177
177 -
 178
178 -
 179
179 -
 180
180 -
181
-
182
-
183
-
184
-
185
-
186
-
187
-
188
-
189
-
190
-
191
-
192
-
193
-
194
-
195
-
196
-
197
-
198
-
199
-
200
-
201
-
202
-
203
-
204
-
205
-
206
-
207
-
208
-
209
-
210
-
211
-
212
-
213
-
214
-
215
-
216
-
217
-
218
-
219
-
220
 |
 |

10-K
DOLLAR GENERAL CORPORATION AND SUBSIDIARIES
NOTES TO CONSOLIDATED FINANCIAL STATEMENTS (Continued)
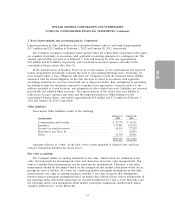
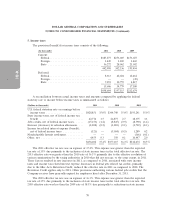
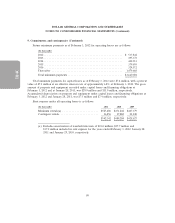
5. Income taxes
The provision (benefit) for income taxes consists of the following:
(In thousands) 2011 2010 2009
Current:
Federal ............................... $385,277 $273,005 $173,027
Foreign ............................... 1,449 1,269 1,465
State ................................ 56,272 28,062 21,002
442,998 302,336 195,494
Deferred:
Federal ............................... 8,313 42,024 12,412
Foreign ............................... — — (49)
State ................................ 7,293 12,755 4,817
15,606 54,779 17,180
$458,604 $357,115 $212,674
A reconciliation between actual income taxes and amounts computed by applying the federal
statutory rate to income before income taxes is summarized as follows:
(Dollars in thousands) 2011 2010 2009
U.S. federal statutory rate on earnings before
income taxes ........................ $428,851 35.0% $344,740 35.0% $193,241 35.0%
State income taxes, net of federal income tax
benefit ............................ 42,774 3.5 26,877 2.7 18,375 3.3
Jobs credits, net of federal income taxes ...... (15,153) (1.2) (8,845) (0.9) (8,590) (1.6)
Increase (decrease) in valuation allowances . . . (2,202) (0.2) (1,003) (0.1) (1,722) (0.3)
Income tax related interest expense (benefit),
net of federal income taxes ............. (121) — (5,004) (0.5) 1,289 0.2
Nondeductible lawsuit settlement ........... — — — — (366) (0.1)
Other, net ........................... 4,455 0.3 350 0.1 10,447 2.0
$458,604 37.4% $357,115 36.3% $212,674 38.5%
The 2011 effective tax rate was an expense of 37.4%. This expense was greater than the expected
tax rate of 35% due primarily to the inclusion of state income taxes in the total effective tax rate. The
2011 effective rate was greater than the 2010 rate of 36.3% primarily due to the effective resolution of
various examinations by the taxing authorities in 2010 that did not reoccur, to the same extent, in 2011.
These factors resulted in rate increases in 2011, as compared to 2010, associated with state income
taxes and income tax related interest expense. Increases in federal jobs related tax credits, primarily
due to the Hire Act’s Retention Credit, reduced the effective rate in 2011 as compared to 2010. The
Retention Credit applies only to 2011. Other provisions authorizing various federal jobs credits that the
Company receives have generally expired for employees hired after December 31, 2011.
The 2010 effective tax rate was an expense of 36.3%. This expense was greater than the expected
tax rate of 35% due primarily to the inclusion of state income taxes in the total effective tax rate. The
2010 effective rate was less than the 2009 rate of 38.5% due principally to reductions in state income
70