Dollar General 2011 Annual Report Download - page 128
Download and view the complete annual report
Please find page 128 of the 2011 Dollar General annual report below. You can navigate through the pages in the report by either clicking on the pages listed below, or by using the keyword search tool below to find specific information within the annual report.-
 1
1 -
2
-
3
-
4
-
5
-
6
-
7
-
8
-
9
-
10
-
11
-
12
-
13
-
14
-
15
-
16
-
17
-
18
-
19
-
20
-
21
-
22
-
23
-
24
-
25
-
26
-
27
-
28
-
29
-
30
-
31
-
32
-
33
-
34
-
35
-
36
-
37
-
38
-
39
-
40
-
41
-
42
-
43
-
44
-
45
-
46
-
47
-
48
-
49
-
50
-
51
-
52
-
53
-
54
-
55
-
56
-
57
-
58
-
59
-
60
-
61
-
62
-
63
-
64
-
65
-
66
-
67
-
68
-
69
-
70
-
71
-
72
-
73
-
74
-
75
-
76
-
77
-
78
-
79
-
80
-
81
-
82
-
83
-
84
-
85
-
86
-
87
-
88
-
89
-
90
-
91
-
92
-
93
-
94
-
95
-
96
-
97
-
98
-
99
-
100
-
101
-
102
-
103
-
104
-
105
-
106
-
107
-
108
-
109
-
110
-
111
-
112
-
113
-
114
-
115
-
116
-
117
-
 118
118 -
 119
119 -
 120
120 -
 121
121 -
 122
122 -
 123
123 -
 124
124 -
 125
125 -
 126
126 -
 127
127 -
 128
128 -
 129
129 -
 130
130 -
 131
131 -
 132
132 -
 133
133 -
 134
134 -
 135
135 -
 136
136 -
 137
137 -
 138
138 -
139
-
140
-
141
-
142
-
143
-
144
-
145
-
146
-
147
-
148
-
149
-
150
-
151
-
152
-
153
-
154
-
155
-
156
-
157
-
158
-
159
-
160
-
161
-
162
-
163
-
164
-
165
-
166
-
167
-
168
-
169
-
170
-
171
-
172
-
173
-
174
-
175
-
176
-
177
-
178
-
179
-
180
-
181
-
182
-
183
-
184
-
185
-
186
-
187
-
188
-
189
-
190
-
191
-
192
-
193
-
194
-
195
-
196
-
197
-
198
-
199
-
200
-
201
-
202
-
203
-
204
-
205
-
206
-
207
-
208
-
209
-
210
-
211
-
212
-
213
-
214
-
215
-
216
-
217
-
218
-
219
-
220
 |
 |

10-K
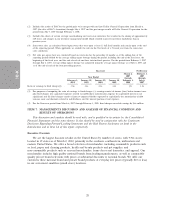
(2) Includes the results of BAC for the period prior to its merger with and into Dollar General Corporation from March 6,
2007 (the date of BAC’s formation) through July 6, 2007 and the post-merger results of Dollar General Corporation for the
period from July 7, 2007 through February 1, 2008.
(3) Includes the effects of certain strategic merchandising and real estate initiatives that resulted in the closing of approximately
460 stores and changes in our inventory management model which resulted in greater inventory markdowns than in
previous years.
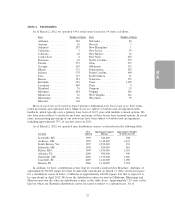
(4) Same-store sales are calculated based upon stores that were open at least 13 full fiscal months and remain open at the end
of the reporting period. When applicable, we exclude the sales in the 53rd week of a 53-week year from the same-store
sales calculation.
(5) Net sales per square foot was calculated based on total sales for the preceding 12 months as of the ending date of the
reporting period divided by the average selling square footage during the period, including the end of the fiscal year, the
beginning of the fiscal year, and the end of each of our three interim fiscal quarters. For the period from February 3, 2007
through July 6, 2007, average selling square footage was calculated using the average square footage as of July 6, 2007 and
as of the end of each of the four preceding quarters.
Successor Predecessor
March 6, February 3,
2007 2007
Year Ended through through
February 3, January 28, January 29, January 30, February 1, July 6,
2012 2011 2010 2009 2008 2007
Ratio of earnings to fixed charges(1): . 3.8x 3.1x 2.1x 1.4x (2) 1.1x
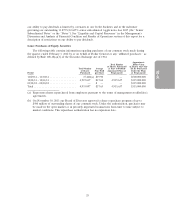
(1) For purposes of computing the ratio of earnings to fixed charges, (a) earnings consist of income (loss) before income taxes,
plus fixed charges less capitalized expenses related to indebtedness (amortization expense for capitalized interest is not
significant) and (b) fixed charges consist of interest expense (whether expensed or capitalized), the amortization of debt
issuance costs and discounts related to indebtedness, and the interest portion of rent expense.
(2) For the Successor period from March 6, 2007 through February 1, 2008, fixed charges exceeded earnings by $6.6 million.
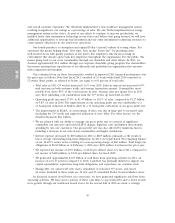
ITEM 7. MANAGEMENT’S DISCUSSION AND ANALYSIS OF FINANCIAL CONDITION AND
RESULTS OF OPERATIONS
This discussion and analysis should be read with, and is qualified in its entirety by, the Consolidated
Financial Statements and the notes thereto. It also should be read in conjunction with the Cautionary
Disclosure Regarding Forward-Looking Statements and the Risk Factors disclosures set forth in the
Introduction and in Item 1A of this report, respectively.
Executive Overview
We are the largest discount retailer in the United States by number of stores, with 9,961 stores
located in 39 states as of March 2, 2012, primarily in the southern, southwestern, midwestern and
eastern United States. We offer a broad selection of merchandise, including consumable products such
as food, paper and cleaning products, health and beauty products and pet supplies, and
non-consumable products such as seasonal merchandise, home decor and domestics, and apparel. Our
merchandise includes high quality national brands from leading manufacturers, as well as comparable
quality private brand selections with prices at substantial discounts to national brands. We offer our
customers these national brand and private brand products at everyday low prices (typically $10 or less)
in our convenient small-box (small store) locations.
28