Dollar General 2011 Annual Report Download - page 169
Download and view the complete annual report
Please find page 169 of the 2011 Dollar General annual report below. You can navigate through the pages in the report by either clicking on the pages listed below, or by using the keyword search tool below to find specific information within the annual report.-
 1
1 -
2
-
3
-
4
-
5
-
6
-
7
-
8
-
9
-
10
-
11
-
12
-
13
-
14
-
15
-
16
-
17
-
18
-
19
-
20
-
21
-
22
-
23
-
24
-
25
-
26
-
27
-
28
-
29
-
30
-
31
-
32
-
33
-
34
-
35
-
36
-
37
-
38
-
39
-
40
-
41
-
42
-
43
-
44
-
45
-
46
-
47
-
48
-
49
-
50
-
51
-
52
-
53
-
54
-
55
-
56
-
57
-
58
-
59
-
60
-
61
-
62
-
63
-
64
-
65
-
66
-
67
-
68
-
69
-
70
-
71
-
72
-
73
-
74
-
75
-
76
-
77
-
78
-
79
-
80
-
81
-
82
-
83
-
84
-
85
-
86
-
87
-
88
-
89
-
90
-
91
-
92
-
93
-
94
-
95
-
96
-
97
-
98
-
99
-
100
-
101
-
102
-
103
-
104
-
105
-
106
-
107
-
108
-
109
-
110
-
111
-
112
-
113
-
114
-
115
-
116
-
117
-
118
-
119
-
120
-
121
-
122
-
123
-
124
-
125
-
126
-
127
-
128
-
129
-
130
-
131
-
132
-
133
-
134
-
135
-
136
-
137
-
138
-
139
-
140
-
141
-
142
-
143
-
144
-
145
-
146
-
147
-
148
-
149
-
150
-
151
-
152
-
153
-
154
-
155
-
156
-
157
-
158
-
 159
159 -
 160
160 -
 161
161 -
 162
162 -
 163
163 -
 164
164 -
 165
165 -
 166
166 -
 167
167 -
 168
168 -
 169
169 -
 170
170 -
 171
171 -
 172
172 -
 173
173 -
 174
174 -
 175
175 -
 176
176 -
 177
177 -
 178
178 -
 179
179 -
180
-
181
-
182
-
183
-
184
-
185
-
186
-
187
-
188
-
189
-
190
-
191
-
192
-
193
-
194
-
195
-
196
-
197
-
198
-
199
-
200
-
201
-
202
-
203
-
204
-
205
-
206
-
207
-
208
-
209
-
210
-
211
-
212
-
213
-
214
-
215
-
216
-
217
-
218
-
219
-
220
 |
 |

10-K
DOLLAR GENERAL CORPORATION AND SUBSIDIARIES
NOTES TO CONSOLIDATED FINANCIAL STATEMENTS (Continued)
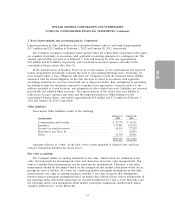
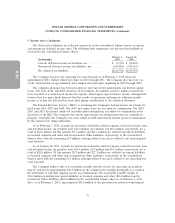
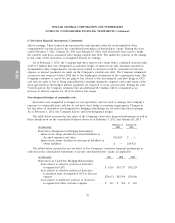
4. Earnings per share
Earnings per share is computed as follows (in thousands except per share data):
2011
Net Weighted Average Per Share
Income Shares Amount
Basic earnings per share ................ $766,685 341,234 $2.25
Effect of dilutive share-based awards ....... 3,883
Diluted earnings per share ............... $766,685 345,117 $2.22
2010
Net Weighted Average Per Share
Income Shares Amount
Basic earnings per share ................ $627,857 341,047 $1.84
Effect of dilutive share-based awards ....... 3,753
Diluted earnings per share ............... $627,857 344,800 $1.82
2009
Net Weighted Average Per Share
Income Shares Amount
Basic earnings per share ................ $339,442 322,778 $1.05
Effect of dilutive share-based awards ....... 2,058
Diluted earnings per share ............... $339,442 324,836 $1.04
Basic earnings per share was computed by dividing net income by the weighted average number of
shares of common stock outstanding during the year. Diluted earnings per share was determined based
on the dilutive effect of share-based awards using the treasury stock method.
Options to purchase shares of common stock that were outstanding at the end of the respective
periods, but were not included in the computation of diluted earnings per share because the effect of
exercising such options would be antidilutive, were zero, 0.4 million and 0.2 million in 2011, 2010 and
2009, respectively.
69