Dollar General 2011 Annual Report Download - page 180
Download and view the complete annual report
Please find page 180 of the 2011 Dollar General annual report below. You can navigate through the pages in the report by either clicking on the pages listed below, or by using the keyword search tool below to find specific information within the annual report.-
 1
1 -
2
-
3
-
4
-
5
-
6
-
7
-
8
-
9
-
10
-
11
-
12
-
13
-
14
-
15
-
16
-
17
-
18
-
19
-
20
-
21
-
22
-
23
-
24
-
25
-
26
-
27
-
28
-
29
-
30
-
31
-
32
-
33
-
34
-
35
-
36
-
37
-
38
-
39
-
40
-
41
-
42
-
43
-
44
-
45
-
46
-
47
-
48
-
49
-
50
-
51
-
52
-
53
-
54
-
55
-
56
-
57
-
58
-
59
-
60
-
61
-
62
-
63
-
64
-
65
-
66
-
67
-
68
-
69
-
70
-
71
-
72
-
73
-
74
-
75
-
76
-
77
-
78
-
79
-
80
-
81
-
82
-
83
-
84
-
85
-
86
-
87
-
88
-
89
-
90
-
91
-
92
-
93
-
94
-
95
-
96
-
97
-
98
-
99
-
100
-
101
-
102
-
103
-
104
-
105
-
106
-
107
-
108
-
109
-
110
-
111
-
112
-
113
-
114
-
115
-
116
-
117
-
118
-
119
-
120
-
121
-
122
-
123
-
124
-
125
-
126
-
127
-
128
-
129
-
130
-
131
-
132
-
133
-
134
-
135
-
136
-
137
-
138
-
139
-
140
-
141
-
142
-
143
-
144
-
145
-
146
-
147
-
148
-
149
-
150
-
151
-
152
-
153
-
154
-
155
-
156
-
157
-
158
-
159
-
160
-
161
-
162
-
163
-
164
-
165
-
166
-
167
-
168
-
169
-
 170
170 -
 171
171 -
 172
172 -
 173
173 -
 174
174 -
 175
175 -
 176
176 -
 177
177 -
 178
178 -
 179
179 -
 180
180 -
 181
181 -
 182
182 -
 183
183 -
 184
184 -
 185
185 -
 186
186 -
 187
187 -
 188
188 -
 189
189 -
 190
190 -
191
-
192
-
193
-
194
-
195
-
196
-
197
-
198
-
199
-
200
-
201
-
202
-
203
-
204
-
205
-
206
-
207
-
208
-
209
-
210
-
211
-
212
-
213
-
214
-
215
-
216
-
217
-
218
-
219
-
220
 |
 |

10-K
DOLLAR GENERAL CORPORATION AND SUBSIDIARIES
NOTES TO CONSOLIDATED FINANCIAL STATEMENTS (Continued)
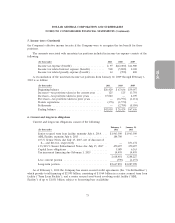
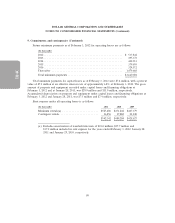
9. Commitments and contingencies (Continued)
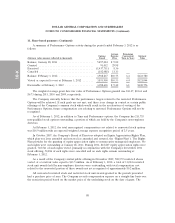
Future minimum payments as of February 3, 2012 for operating leases are as follows:
(In thousands)
2012 .................................................. $ 537,842
2013 .................................................. 495,373
2014 .................................................. 442,913
2015 .................................................. 379,693
2016 .................................................. 324,512
Thereafter ............................................. 1,479,668
Total minimum payments ................................... $3,660,001
Total minimum payments for capital leases as of February 3, 2012 were $7.4 million, with a present
value of $5.1 million at an effective interest rate of approximately 6.8% at February 3, 2012. The gross
amount of property and equipment recorded under capital leases and financing obligations at
February 3, 2012 and at January 28, 2011, was $29.0 million and $31.0 million, respectively.
Accumulated depreciation on property and equipment under capital leases and financing obligations at
February 3, 2012 and January 28, 2011, was $7.3 million and $7.4 million, respectively.
Rent expense under all operating leases is as follows:
(In thousands) 2011 2010 2009
Minimum rentals(a) ....................... $525,486 $471,402 $407,379
Contingent rentals ........................ 16,856 17,882 21,248
$542,342 $489,284 $428,627
(a) Excludes amortization of leasehold interests of $21.0 million, $25.7 million and
$37.2 million included in rent expense for the years ended February 3, 2012, January 28,
2011 and January 29, 2010, respectively.
80