Dollar General 2008 Annual Report Download - page 9
Download and view the complete annual report
Please find page 9 of the 2008 Dollar General annual report below. You can navigate through the pages in the report by either clicking on the pages listed below, or by using the keyword search tool below to find specific information within the annual report.-
 1
1 -
 2
2 -
 3
3 -
 4
4 -
 5
5 -
 6
6 -
 7
7 -
 8
8 -
 9
9 -
 10
10 -
 11
11 -
 12
12 -
 13
13 -
 14
14 -
 15
15 -
 16
16 -
 17
17 -
 18
18 -
 19
19 -
 20
20 -
21
-
22
-
23
-
24
-
25
-
26
-
27
-
28
-
29
-
30
-
31
-
32
-
33
-
34
-
35
-
36
-
37
-
38
-
39
-
40
-
41
-
42
-
43
-
44
-
45
-
46
-
47
-
48
-
49
-
50
-
51
-
52
-
53
-
54
-
55
-
56
-
57
-
58
-
59
-
60
-
61
-
62
-
63
-
64
-
65
-
66
-
67
-
68
-
69
-
70
-
71
-
72
-
73
-
74
-
75
-
76
-
77
-
78
-
79
-
80
-
81
-
82
-
83
-
84
-
85
-
86
-
87
-
88
-
89
-
90
-
91
-
92
-
93
-
94
-
95
-
96
-
97
-
98
-
99
-
100
-
101
-
102
-
103
-
104
-
105
-
106
-
107
-
108
-
109
-
110
-
111
-
112
-
113
-
114
-
115
-
116
-
117
-
118
-
119
-
120
-
121
-
122
-
123
-
124
-
125
-
126
-
127
-
128
-
129
-
130
-
131
-
132
-
133
-
134
-
135
-
136
-
137
-
138
-
139
-
140
-
141
-
142
-
143
-
144
-
145
-
146
-
147
-
148
-
149
-
150
-
151
-
152
-
153
-
154
-
155
-
156
-
157
-
158
-
159
-
160
-
161
-
162
-
163
-
164
-
165
-
166
-
167
-
168
-
169
-
170
-
171
-
172
-
173
-
174
-
175
-
176
-
177
-
178
-
179
-
180
-
181
-
182
-
183
-
184
-
185
-
186
-
187
-
188
-
189
 |
 |

7
Seasonality
Our business is seasonal to a certain extent. Generally, our highest sales volume occurs
in the fourth quarter, which includes the Christmas selling season, and the lowest occurs in the
first quarter. In addition, our quarterly results can be affected by the timing of new store
openings and store closings, the amount of sales contributed by new and existing stores, as well
as the timing of certain holidays. We purchase substantial amounts of inventory in the third
quarter and incur higher shipping costs and higher payroll costs in anticipation of the increased
sales activity during the fourth quarter. In addition, we carry merchandise during our fourth
quarter that we do not carry during the rest of the year, such as gift sets, holiday decorations,
certain baking items, and a broader assortment of toys and candy.
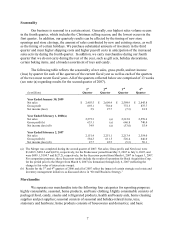
The following table reflects the seasonality of net sales, gross profit, and net income
(loss) by quarter for each of the quarters of the current fiscal year as well as each of the quarters
of the two most recent fiscal years. All of the quarters reflected below are comprised of 13 weeks
(see note (a) regarding results for the second quarter of 2007).
(in millions)
1st
Quarter
2nd
Quarter
3rd
Quarter
4th
Quarter
Year Ended January 30, 2009
Net sales
$
2,403.5
$
2,609.4
$
2,598.9
$
2,845.8
Gross profit
693.1
758.0
772.3
837.7
Net income (loss)
5.9
27.7
(7.3)
81.9
Year Ended February 1, 2008(a)
Net sales
2,275.3
(a)
2,312.8
2,559.6
Gross profit (b)
633.1
(a)
646.8
740.4
Net income (loss) (b)
34.9
(a)
(33.0)
55.4
Year Ended February 2, 2007
Net sales
2,151.4
2,251.1
2,213.4
2,554.0
Gross profit (b)
584.3
611.5
526.4
646.0
Net income (loss) (b)
47.7
45.5
(5.3)
50.1
(a) The Merger was completed during the second quarter of 2007. Net sales, Gross profit, and Net (loss) were
$1,648.5, $438.5 and $(42.9), respectively, for the Predecessor period from May 5, 2007 to July 6, 2007, and
were $699.1, $184.7 and $(27.2), respectively, for the Successor period from March 6, 2007 to August 3, 2007.
For comparison purposes, these Successor results include the results of operations for Buck Acquisition Corp.
for the period prior to the Merger from March 6, 2007 (its formation) through July 6, 2007 (reflecting the
change in fair value of interest rate swaps).
(b) Results for the 3rd and 4th quarters of 2006 and all of 2007 reflect the impact of certain strategic real estate and
inventory management initiatives as discussed above in “Overall Business Strategy.”
Merchandise
We separate our merchandise into the following four categories for reporting purposes:
highly consumable, seasonal, home products, and basic clothing. Highly consumable consists of
packaged food, candy, snacks and refrigerated products, health and beauty aids, home cleaning
supplies and pet supplies; seasonal consists of seasonal and holiday-related items, toys,
stationery and hardware; home products consists of housewares and domestics; and basic