Dollar General 2008 Annual Report Download - page 48
Download and view the complete annual report
Please find page 48 of the 2008 Dollar General annual report below. You can navigate through the pages in the report by either clicking on the pages listed below, or by using the keyword search tool below to find specific information within the annual report.-
 1
1 -
2
-
3
-
4
-
5
-
6
-
7
-
8
-
9
-
10
-
11
-
12
-
13
-
14
-
15
-
16
-
17
-
18
-
19
-
20
-
21
-
22
-
23
-
24
-
25
-
26
-
27
-
28
-
29
-
30
-
31
-
32
-
33
-
34
-
35
-
36
-
37
-
 38
38 -
 39
39 -
 40
40 -
 41
41 -
 42
42 -
 43
43 -
 44
44 -
 45
45 -
 46
46 -
 47
47 -
 48
48 -
 49
49 -
 50
50 -
 51
51 -
 52
52 -
 53
53 -
 54
54 -
 55
55 -
 56
56 -
 57
57 -
 58
58 -
59
-
60
-
61
-
62
-
63
-
64
-
65
-
66
-
67
-
68
-
69
-
70
-
71
-
72
-
73
-
74
-
75
-
76
-
77
-
78
-
79
-
80
-
81
-
82
-
83
-
84
-
85
-
86
-
87
-
88
-
89
-
90
-
91
-
92
-
93
-
94
-
95
-
96
-
97
-
98
-
99
-
100
-
101
-
102
-
103
-
104
-
105
-
106
-
107
-
108
-
109
-
110
-
111
-
112
-
113
-
114
-
115
-
116
-
117
-
118
-
119
-
120
-
121
-
122
-
123
-
124
-
125
-
126
-
127
-
128
-
129
-
130
-
131
-
132
-
133
-
134
-
135
-
136
-
137
-
138
-
139
-
140
-
141
-
142
-
143
-
144
-
145
-
146
-
147
-
148
-
149
-
150
-
151
-
152
-
153
-
154
-
155
-
156
-
157
-
158
-
159
-
160
-
161
-
162
-
163
-
164
-
165
-
166
-
167
-
168
-
169
-
170
-
171
-
172
-
173
-
174
-
175
-
176
-
177
-
178
-
179
-
180
-
181
-
182
-
183
-
184
-
185
-
186
-
187
-
188
-
189
 |
 |
46
observable data or information derived from or corroborated by market-observable data,
including market-based inputs to models, model calibration to market-clearing transactions,
broker or dealer quotations, or alternative pricing sources with reasonable levels of price
transparency. Where models are used, the selection of a particular model to value a derivative
depends upon the contractual terms of, and specific risks inherent in, the instrument as well as
the availability of pricing information in the market. We use similar models to value similar
instruments. Valuation models require a variety of inputs, including contractual terms, market
prices, yield curves, credit curves, measures of volatility, and correlations of such inputs. For
our derivatives, all of which trade in liquid markets, model inputs can generally be verified and
model selection does not involve significant management judgment.
To comply with the provisions of SFAS 157, we incorporate credit valuation adjustments
to appropriately reflect both our own nonperformance risk and the respective counterparty’ s
nonperformance risk in the fair value measurements of our derivatives. The credit valuation
adjustments are calculated by determining the total expected exposure of the derivatives (which
incorporates both the current and potential future exposure) and then applying each
counterparty’ s credit spread to the applicable exposure. For derivatives with two-way exposure,
such as interest rate swaps, the counterparty’ s credit spread is applied to our exposure to the
counterparty, and our own credit spread is applied to the counterparty’ s exposure to us, and the
net credit valuation adjustment is reflected in our derivative valuations. The total expected
exposure of a derivative is derived using market-observable inputs, such as yield curves and
volatilities. The inputs utilized for our own credit spread are based on implied spreads from our
publicly-traded debt. For counterparties with publicly available credit information, the credit
spreads over LIBOR used in the calculations represent implied credit default swap spreads
obtained from a third party credit data provider. In adjusting the fair value of our derivative
contracts for the effect of nonperformance risk, we have considered the impact of netting and any
applicable credit enhancements, such as collateral postings, thresholds, mutual puts, and
guarantees. Additionally, we actively monitor counterparty credit ratings for any significant
changes.
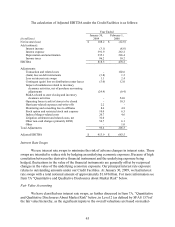
As of January 30, 2009, the net credit valuation adjustments reduced the settlement
values of our derivative liabilities by $8.5 million. Various factors impact changes in the credit
valuation adjustments over time, including changes in the credit spreads of the parties to the
contracts, as well as changes in market rates and volatilities, which affect the total expected
exposure of the derivative instruments. When appropriate, valuations are also adjusted for
various factors such as liquidity and bid/offer spreads, which factors we deemed to be immaterial
as of January 30, 2009.
Other Considerations
Our inventory balance represented approximately 44% of our total assets exclusive of
goodwill and other intangible assets as of January 30, 2009. Our proficiency in managing our
inventory balances can have a significant impact on our cash flows from operations during a
given fiscal year. As a result, efficient inventory management has been and continues to be an
area of focus for us.