Dollar General 2008 Annual Report Download - page 127
Download and view the complete annual report
Please find page 127 of the 2008 Dollar General annual report below. You can navigate through the pages in the report by either clicking on the pages listed below, or by using the keyword search tool below to find specific information within the annual report.-
 1
1 -
2
-
3
-
4
-
5
-
6
-
7
-
8
-
9
-
10
-
11
-
12
-
13
-
14
-
15
-
16
-
17
-
18
-
19
-
20
-
21
-
22
-
23
-
24
-
25
-
26
-
27
-
28
-
29
-
30
-
31
-
32
-
33
-
34
-
35
-
36
-
37
-
38
-
39
-
40
-
41
-
42
-
43
-
44
-
45
-
46
-
47
-
48
-
49
-
50
-
51
-
52
-
53
-
54
-
55
-
56
-
57
-
58
-
59
-
60
-
61
-
62
-
63
-
64
-
65
-
66
-
67
-
68
-
69
-
70
-
71
-
72
-
73
-
74
-
75
-
76
-
77
-
78
-
79
-
80
-
81
-
82
-
83
-
84
-
85
-
86
-
87
-
88
-
89
-
90
-
91
-
92
-
93
-
94
-
95
-
96
-
97
-
98
-
99
-
100
-
101
-
102
-
103
-
104
-
105
-
106
-
107
-
108
-
109
-
110
-
111
-
112
-
113
-
114
-
115
-
116
-
 117
117 -
 118
118 -
 119
119 -
 120
120 -
 121
121 -
 122
122 -
 123
123 -
 124
124 -
 125
125 -
 126
126 -
 127
127 -
 128
128 -
 129
129 -
 130
130 -
 131
131 -
 132
132 -
 133
133 -
 134
134 -
 135
135 -
 136
136 -
 137
137 -
138
-
139
-
140
-
141
-
142
-
143
-
144
-
145
-
146
-
147
-
148
-
149
-
150
-
151
-
152
-
153
-
154
-
155
-
156
-
157
-
158
-
159
-
160
-
161
-
162
-
163
-
164
-
165
-
166
-
167
-
168
-
169
-
170
-
171
-
172
-
173
-
174
-
175
-
176
-
177
-
178
-
179
-
180
-
181
-
182
-
183
-
184
-
185
-
186
-
187
-
188
-
189
 |
 |

125
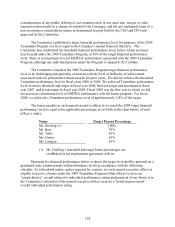
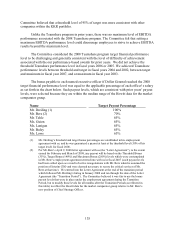
% of Target Performance Level
% of Bonus Target
95%
50%
96%
60%
97%
70%
98%
80%
99%
90%
100%
100%
101%
110%
102%
120%
103%
130%
104%
140%
105%
150%
106%
160%
107%
170%
108%
180%
109%
190%
110% (1)
200% (1)
(1) For every 1% EBITDA increase over 110%, each named executive
officer is eligible to receive an additional 9.14% of his or her bonus
target.
PART III
ITEM 10. DIRECTORS, EXECUTIVE OFFICERS AND CORPORATE
GOVERNANCE
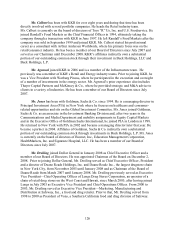
(a) Information Regarding Directors and Executive Officers. Information regarding
our current directors and executive officers as of March 17, 2009 is set forth below. Each of our
directors holds office for a term of 1 year or until a successor is elected and qualified. Each of
our executive officers serves at the pleasure of our Board of Directors and is elected annually by
the Board to serve until a successor is duly elected. There are no familial relationships between
any of our directors or executive officers.
Name
Age
Position
Michael M. Calbert
46
Director
Raj Agrawal
35
Director
Adrian Jones
44
Director
Richard W. Dreiling
55
Director; Chairman & Chief Executive Officer
David L. Bere
55
President & Chief Strategy Officer
David M. Tehle
52
Executive Vice President & Chief Financial Officer
Kathleen R. Guion
57
Executive Vice President, Division President, Store Operations & Store
Development
Todd J. Vasos
47
Executive Vice President, Division President & Chief Merchandising Officer
Susan S. Lanigan
46
Executive Vice President & General Counsel
Anita C. Elliott
44
Senior Vice President & Controller
John W. Flanigan
57
Senior Vice President, Global Supply Chain
Robert D. Ravener
50
Senior Vice President & Chief People Officer