Dollar General 2008 Annual Report Download - page 34
Download and view the complete annual report
Please find page 34 of the 2008 Dollar General annual report below. You can navigate through the pages in the report by either clicking on the pages listed below, or by using the keyword search tool below to find specific information within the annual report.32
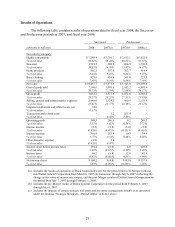
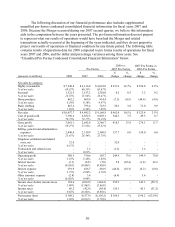
forma 2007. Factors contributing to the increase in the 2008 gross profit rate include a lower
inventory shrink rate; lower promotional markdowns; improved leverage on distribution and
transportation costs; and improved markups related to changes resulting from the outcome of
pricing analysis, our ability to react more quickly to product cost changes and diligent vendor
negotiations. In January 2009, we marked down merchandise as the result of a recent change in
the interpretation of the phthalates provision of the Consumer Product Safety Improvement Act
of 2008 resulting in a charge of $8.6 million. Also in 2008, we faced increased commodity cost
pressures mainly related to food and pet products which have been driven by rising fruit and
vegetable prices and freight costs. Increases in petroleum, resin, metals, pulp and other raw
material commodity driven costs also resulted in multiple product cost increases. Related to
these commodity cost increases, we recorded a LIFO provision of $43.9 million in 2008,
compared to the LIFO provision recorded in the 2007 Successor period of $6.1 million. We
intend to address these commodity cost increases through negotiations with our vendors and by
increasing retail prices as necessary. On a quarterly basis, we estimate the annual impact of
commodity cost fluctuations based upon the best available information at that point in time.
The gross profit rate as a percentage of sales was 27.3% in the 2007 Predecessor period,
28.2% in the 2007 Successor period, and 27.8% in pro forma 2007 compared to 25.8% in 2006.
Factors affecting the increase in the gross profit rate include: lower markdowns, including
markdowns from retail and below cost markdowns (markdowns in 2006 included significant
markdowns and below cost adjustments relating to the move away from our packaway inventory
strategy); and improved leverage on distribution and transportation costs driven by logistics
efficiencies. The gross profit rate in the 2007 Successor period was greater than in the
Predecessor period, in part due to the seasonality of our sales which result in greater sales of
higher margin discretionary purchases in the fourth quarter. Offsetting the factors listed above
was an increase in our shrink rate in the 2007 periods as compared to 2006 and a shift in the mix
of sales to more highly consumable products which have relatively lower gross profit rates.
Selling, General and Administrative (“SG&A”) Expense. SG&A expense as a
percentage of sales decreased to 23.4% in 2008, compared to 23.8% and 24.5% in the 2007
Successor and Predecessor periods, respectively. The more significant items resulting in the
decrease in 2008 compared to the 2007 periods include: approximately $9.0 million and $45.0
million in the 2007 Successor and Predecessor periods, respectively (including $2.4 million and
$4.1 million, respectively, also included in advertising costs discussed below) relating to the
closing of stores and the elimination of our packaway inventory strategy; $40.5 million in 2008
compared to $23.4 million in the 2007 Successor period related to amortization of leasehold
intangibles capitalized in connection with the revaluation of assets at the date of the Merger; a
$12.0 million loss in the 2007 Successor period compared to a $5.0 million gain in 2008 relating
to potential losses on distribution center leases; advertising costs of $27.8 million in 2008
compared to $23.6 million and $17.3 million in the 2007 Successor and Predecessor periods,
respectively; and decreases in workers compensation and other insurance-related costs compared
to the 2007 periods. These decreases were partially offset by an increase in incentive
compensation and related payroll taxes in 2008 compared to the 2007 periods due to improved
overall financial performance and an increase in professional fees in 2008 compared to the 2007
periods primarily reflecting legal expenses related to shareholder litigation.


