Dollar General 2008 Annual Report Download - page 32
Download and view the complete annual report
Please find page 32 of the 2008 Dollar General annual report below. You can navigate through the pages in the report by either clicking on the pages listed below, or by using the keyword search tool below to find specific information within the annual report.-
 1
1 -
2
-
3
-
4
-
5
-
6
-
7
-
8
-
9
-
10
-
11
-
12
-
13
-
14
-
15
-
16
-
17
-
18
-
19
-
20
-
21
-
 22
22 -
 23
23 -
 24
24 -
 25
25 -
 26
26 -
 27
27 -
 28
28 -
 29
29 -
 30
30 -
 31
31 -
 32
32 -
 33
33 -
 34
34 -
 35
35 -
 36
36 -
 37
37 -
 38
38 -
 39
39 -
 40
40 -
 41
41 -
 42
42 -
43
-
44
-
45
-
46
-
47
-
48
-
49
-
50
-
51
-
52
-
53
-
54
-
55
-
56
-
57
-
58
-
59
-
60
-
61
-
62
-
63
-
64
-
65
-
66
-
67
-
68
-
69
-
70
-
71
-
72
-
73
-
74
-
75
-
76
-
77
-
78
-
79
-
80
-
81
-
82
-
83
-
84
-
85
-
86
-
87
-
88
-
89
-
90
-
91
-
92
-
93
-
94
-
95
-
96
-
97
-
98
-
99
-
100
-
101
-
102
-
103
-
104
-
105
-
106
-
107
-
108
-
109
-
110
-
111
-
112
-
113
-
114
-
115
-
116
-
117
-
118
-
119
-
120
-
121
-
122
-
123
-
124
-
125
-
126
-
127
-
128
-
129
-
130
-
131
-
132
-
133
-
134
-
135
-
136
-
137
-
138
-
139
-
140
-
141
-
142
-
143
-
144
-
145
-
146
-
147
-
148
-
149
-
150
-
151
-
152
-
153
-
154
-
155
-
156
-
157
-
158
-
159
-
160
-
161
-
162
-
163
-
164
-
165
-
166
-
167
-
168
-
169
-
170
-
171
-
172
-
173
-
174
-
175
-
176
-
177
-
178
-
179
-
180
-
181
-
182
-
183
-
184
-
185
-
186
-
187
-
188
-
189
 |
 |

30
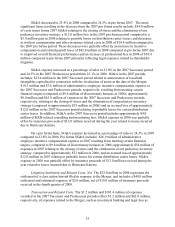
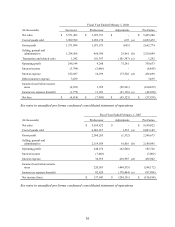
The following discussion of our financial performance also includes supplemental
unaudited pro forma condensed consolidated financial information for fiscal years 2007 and
2006. Because the Merger occurred during our 2007 second quarter, we believe this information
aids in the comparison between the years presented. The pro forma information does not purport
to represent what our results of operations would have been had the Merger and related
transactions actually occurred at the beginning of the years indicated, and they do not purport to
project our results of operations or financial condition for any future period. The following table
contains results of operations data for 2008 compared to pro forma results of operations for fiscal
years 2007 and 2006, and the dollar and percentage variances among those years. See
“Unaudited Pro Forma Condensed Consolidated Financial Information” below.
(amounts in millions)
2008
Pro Forma
2008 vs.
2007 Pro Forma
2007 Pro Forma vs.
2006 Pro Forma
2007
2006
$
change
%
change
$
change
%
change
Net sales by category:
Highly consumable
$ 7,248.4
$ 6,316.8
$ 6,022.0
$ 931.6
14.7%
$ 294.8
4.9%
% of net sales
69.31%
66.53%
65.67%
Seasonal
1,521.5
1,513.2
1,510.0
8.2
0.5
3.2
0.2
% of net sales
14.55%
15.94%
16.47%
Home products
862.2
869.8
914.4
(7.5)
(0.9)
(44.6)
(4.9)
% of net sales
8.24%
9.16%
9.97%
Basic clothing
825.6
795.4
723.5
30.2
3.8
72.0
9.9
% of net sales
7.89%
8.38%
7.89%
Net sales
$ 10,457.7
$ 9,495.2
$ 9,169.8
$ 962.4
10.1%
$ 325.4
3.5%
Cost of goods sold
7,396.6
6,852.5
6,803.1
544.1
7.9
49.3
0.7
% of net sales
70.73%
72.17%
74.19%
Gross profit
3,061.1
2,642.8
2,366.7
418.3
15.8
276.1
11.7
% of net sales
29.27%
27.83%
25.81%
Selling, general and administrative
expenses
2,448.6
2,310.9
2,180.9
137.7
6.0
130.0
6.0
% of net sales
23.41%
24.34%
23.78%
Litigation settlement and related
costs, net 32.0 - - 32.0 - - -
% of net sales
0.31%
-
-
-
-
Transaction and related costs
-
1.2
-
(1.2)
-
1.2
-
% of net sales
-
0.01%
-
Operating profit
580.5
330.6
185.7
249.9
75.6
144.9
78.0
% of net sales
5.55%
3.48%
2.03%
Interest income
(3.1)
(8.8)
(7.0)
5.8
(65.4)
(1.8)
26.3
% of net sales
(0.03)%
(0.09)%
(0.08)%
Interest expense
391.9
436.7
436.9
(44.8)
(10.3)
(0.2)
(0.0)
% of net sales
3.75%
4.60%
4.76%
Other (income) expense
(2.8)
3.6
-
(6.4)
-
3.6
-
% of net sales
(0.03)%
0.04%
-
Income (loss) before income taxes
194.4
(100.9)
(244.2)
295.3
-
143.3
(58.7)
% of net sales
1.86%
(1.06)%
(2.66)%
Income taxes
86.2
(42.9)
(88.0)
129.1
-
45.1
(51.2)
% of net sales
0.82%
(0.45)%
(0.96)%
Net income (loss)
$ 108.2
$ (57.9)
$ (156.2)
$ 166.1
-%
$ 98.2
(62.9)%
% of net sales
1.03%
(0.61)%
(1.70)%