Dollar General 2008 Annual Report Download - page 123
Download and view the complete annual report
Please find page 123 of the 2008 Dollar General annual report below. You can navigate through the pages in the report by either clicking on the pages listed below, or by using the keyword search tool below to find specific information within the annual report.-
 1
1 -
2
-
3
-
4
-
5
-
6
-
7
-
8
-
9
-
10
-
11
-
12
-
13
-
14
-
15
-
16
-
17
-
18
-
19
-
20
-
21
-
22
-
23
-
24
-
25
-
26
-
27
-
28
-
29
-
30
-
31
-
32
-
33
-
34
-
35
-
36
-
37
-
38
-
39
-
40
-
41
-
42
-
43
-
44
-
45
-
46
-
47
-
48
-
49
-
50
-
51
-
52
-
53
-
54
-
55
-
56
-
57
-
58
-
59
-
60
-
61
-
62
-
63
-
64
-
65
-
66
-
67
-
68
-
69
-
70
-
71
-
72
-
73
-
74
-
75
-
76
-
77
-
78
-
79
-
80
-
81
-
82
-
83
-
84
-
85
-
86
-
87
-
88
-
89
-
90
-
91
-
92
-
93
-
94
-
95
-
96
-
97
-
98
-
99
-
100
-
101
-
102
-
103
-
104
-
105
-
106
-
107
-
108
-
109
-
110
-
111
-
112
-
 113
113 -
 114
114 -
 115
115 -
 116
116 -
 117
117 -
 118
118 -
 119
119 -
 120
120 -
 121
121 -
 122
122 -
 123
123 -
 124
124 -
 125
125 -
 126
126 -
 127
127 -
 128
128 -
 129
129 -
 130
130 -
 131
131 -
 132
132 -
 133
133 -
134
-
135
-
136
-
137
-
138
-
139
-
140
-
141
-
142
-
143
-
144
-
145
-
146
-
147
-
148
-
149
-
150
-
151
-
152
-
153
-
154
-
155
-
156
-
157
-
158
-
159
-
160
-
161
-
162
-
163
-
164
-
165
-
166
-
167
-
168
-
169
-
170
-
171
-
172
-
173
-
174
-
175
-
176
-
177
-
178
-
179
-
180
-
181
-
182
-
183
-
184
-
185
-
186
-
187
-
188
-
189
 |
 |

121
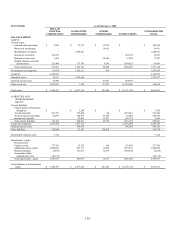
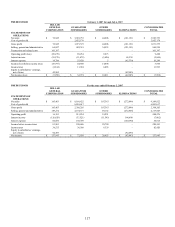
PREDECESSOR
For the year ended February 2, 2007
DOLLAR
GENERAL
CORPORATION
GUARANTOR
SUBSIDIARIES
OTHER
SUBSIDIARIES ELIMINATIONS
CONSOLIDATED
TOTAL
STATEMENTS OF CASH FLOWS:
Cash flows from operating activities:
Net income
$
137,943
$
72,038
$
20,455
$
(92,493)
$
137,943
Adjustments to reconcile net income to
net cash provided by operating
activities:
Depreciation and amortization 21,436
178,920 252 - 200,608
Deferred income taxes
(1,845)
(35,118)
(1,255)
-
(38,218)
Tax benefit of stock options (2,513)
- - - (2,513)
Noncash inventory adjustments and
asset impairments -
76,599 - - 76,599
Noncash share-based compensation
7,578
-
-
-
7,578
Other noncash gains and losses -
5,820 - - 5,820
Equity in subsidiaries’ earnings, net (92,493)
- - 92,493 -
Change in operating assets and
liabilities:
Merchandise inventories
-
(26,541)
-
-
(26,541)
Prepaid expenses and other current
assets (1,042) (13,655) 9,286 - (5,411)
Accounts payable
(4,246)
39,189
18,601
-
53,544
Accrued expenses and other (225)
38,564 14 - 38,353
Income taxes
(2,558)
(29,524)
(3,083)
-
(35,165)
Other 430
(7,670) - - (7,240)
Net cash provided by operating
activities 62,465 298,622 44,270 - 405,357
Cash flows from investing activities:
Purchases of property and equipment
(13,270)
(247,788)
(457)
-
(261,515)
Purchases of short-term investments (38,700)
- (10,975) - (49,675)
Sales of short-term investments
38,700
-
12,825
-
51,525
Purchases of long-term investments -
- (25,756) - (25,756)
Sale and insurance proceeds related to
property and equipment
143
3,303
11
-
3,457
Net cash used in investing activities
(13,127)
(244,485)
(24,352)
-
(281,964)
Cash flows from financing activities:
Net borrowings (repayments) under
revolving credit facility
-
-
-
-
-
Repayments of long-term obligations 97
(14,215) - - (14,118)
Debt issuance costs
(584)
-
-
-
(584)
Payment of cash dividends (62,472)
- - - (62,472)
Exercises of stock options
19,894
-
-
-
19,894
Repurchases of common stock (79,947)
- - - (79,947)
Tax benefit of stock options
2,513
-
-
-
2,513
Changes in intercompany note balances,
net 75,061 (40,299) (34,762) - -
Net cash used in financing activities (45,438)
(54,514) (34,762) - (134,714)
Net increase (decrease) in cash and cash
equivalents
3,900
(377)
(14,844)
-
(11,321)
Cash and cash equivalents, beginning of
year 110,410 58,484 31,715 - 200,609
Cash and cash equivalents, end of year
$
114,310
$
58,107
$
16,871
$
-
$
189,288