Dollar General 2008 Annual Report Download - page 109
Download and view the complete annual report
Please find page 109 of the 2008 Dollar General annual report below. You can navigate through the pages in the report by either clicking on the pages listed below, or by using the keyword search tool below to find specific information within the annual report.-
 1
1 -
2
-
3
-
4
-
5
-
6
-
7
-
8
-
9
-
10
-
11
-
12
-
13
-
14
-
15
-
16
-
17
-
18
-
19
-
20
-
21
-
22
-
23
-
24
-
25
-
26
-
27
-
28
-
29
-
30
-
31
-
32
-
33
-
34
-
35
-
36
-
37
-
38
-
39
-
40
-
41
-
42
-
43
-
44
-
45
-
46
-
47
-
48
-
49
-
50
-
51
-
52
-
53
-
54
-
55
-
56
-
57
-
58
-
59
-
60
-
61
-
62
-
63
-
64
-
65
-
66
-
67
-
68
-
69
-
70
-
71
-
72
-
73
-
74
-
75
-
76
-
77
-
78
-
79
-
80
-
81
-
82
-
83
-
84
-
85
-
86
-
87
-
88
-
89
-
90
-
91
-
92
-
93
-
94
-
95
-
96
-
97
-
98
-
 99
99 -
 100
100 -
 101
101 -
 102
102 -
 103
103 -
 104
104 -
 105
105 -
 106
106 -
 107
107 -
 108
108 -
 109
109 -
 110
110 -
 111
111 -
 112
112 -
 113
113 -
 114
114 -
 115
115 -
 116
116 -
 117
117 -
 118
118 -
 119
119 -
120
-
121
-
122
-
123
-
124
-
125
-
126
-
127
-
128
-
129
-
130
-
131
-
132
-
133
-
134
-
135
-
136
-
137
-
138
-
139
-
140
-
141
-
142
-
143
-
144
-
145
-
146
-
147
-
148
-
149
-
150
-
151
-
152
-
153
-
154
-
155
-
156
-
157
-
158
-
159
-
160
-
161
-
162
-
163
-
164
-
165
-
166
-
167
-
168
-
169
-
170
-
171
-
172
-
173
-
174
-
175
-
176
-
177
-
178
-
179
-
180
-
181
-
182
-
183
-
184
-
185
-
186
-
187
-
188
-
189
 |
 |

107
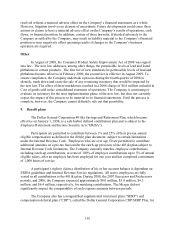
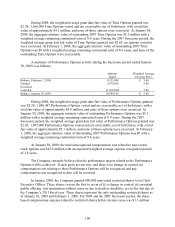
Successor Period Ended
Predecessor Period Ended
January 30,
2009
February 1,
2008
July 6,
2007
February 2,
2007
Expected dividend yield
0
%
0
%
0.91
%
0.82
%
Expected stock price volatility
40.2
%
41.9
%
18.5
%
28.8
%
Weighted average risk-free interest rate
2.8
%
4.6
%
4.5
%
4.7
%
Expected term of options (years)
7.4
7.5
5.7
5.7
Expected dividend yield - This is an estimate of the expected dividend yield on the
Company’ s stock. Prior to the Merger this estimate was based on historical dividend payment
trends. Subsequent to the Merger, the Company is subject to limitations on the payment of
dividends under its credit facilities as further discussed in Note 6. An increase in the dividend
yield will decrease compensation expense.
Expected stock price volatility - This is a measure of the amount by which the price of
the Company’ s common stock has fluctuated or is expected to fluctuate. Prior to the Merger, the
Company used actual historical changes in the market price of the Company’ s common stock
and implied volatility based upon traded options, weighted equally, to calculate the volatility
assumption, as it was the Company’ s belief that this methodology provided the best indicator of
future volatility. For historical volatility, the Company calculated daily market price changes
from the date of grant over a past period representative of the expected life of the options to
determine volatility. Subsequent to the Merger the expected volatilities have been based upon the
historical volatilities of a peer group of four companies, as the Company’ s common stock is not
publicly traded. An increase in the expected volatility will increase compensation expense.
Weighted average risk-free interest rate - This is the U.S. Treasury rate for the week of
the grant having a term approximating the expected life of the option. An increase in the risk-free
interest rate will increase compensation expense.
Expected term of options - This is the period of time over which the options granted are
expected to remain outstanding. For options issued prior to the Merger, the Company took into
consideration that its stock option grants prior to August 2002 were significantly different than
grants issued on and after that date, and therefore that the historical and post-vesting employee
behavior patterns for grants prior to that date were of little or no value in determining future
expectations. As a result, the Company excluded these pre-August 2002 grants from its analysis
of expected term. For pre-Merger options, the Company estimated expected term using a
computation based on an assumption that outstanding options would be exercised approximately
halfway through their contractual term, taking into consideration such factors as grant date,
expiration date, weighted-average time-to-vest, actual exercises and post-vesting cancellations.
Options granted have a maximum term of 10 years. Due to the absence of historical data for
grants issued subsequent to the Merger, the Company has estimated the expected term as the
mid-point between the vesting date and the contractual term of the option. An increase in the
expected term will increase compensation expense.
All nonvested restricted stock and restricted stock unit awards granted in the 2007
Successor and Predecessor periods had a purchase price of zero. The Company records
compensation expense on a straight-line basis over the restriction period based on the market
price of the underlying stock on the date of grant. The nonvested restricted stock and restricted