Dollar General 2008 Annual Report Download - page 121
Download and view the complete annual report
Please find page 121 of the 2008 Dollar General annual report below. You can navigate through the pages in the report by either clicking on the pages listed below, or by using the keyword search tool below to find specific information within the annual report.-
 1
1 -
2
-
3
-
4
-
5
-
6
-
7
-
8
-
9
-
10
-
11
-
12
-
13
-
14
-
15
-
16
-
17
-
18
-
19
-
20
-
21
-
22
-
23
-
24
-
25
-
26
-
27
-
28
-
29
-
30
-
31
-
32
-
33
-
34
-
35
-
36
-
37
-
38
-
39
-
40
-
41
-
42
-
43
-
44
-
45
-
46
-
47
-
48
-
49
-
50
-
51
-
52
-
53
-
54
-
55
-
56
-
57
-
58
-
59
-
60
-
61
-
62
-
63
-
64
-
65
-
66
-
67
-
68
-
69
-
70
-
71
-
72
-
73
-
74
-
75
-
76
-
77
-
78
-
79
-
80
-
81
-
82
-
83
-
84
-
85
-
86
-
87
-
88
-
89
-
90
-
91
-
92
-
93
-
94
-
95
-
96
-
97
-
98
-
99
-
100
-
101
-
102
-
103
-
104
-
105
-
106
-
107
-
108
-
109
-
110
-
 111
111 -
 112
112 -
 113
113 -
 114
114 -
 115
115 -
 116
116 -
 117
117 -
 118
118 -
 119
119 -
 120
120 -
 121
121 -
 122
122 -
 123
123 -
 124
124 -
 125
125 -
 126
126 -
 127
127 -
 128
128 -
 129
129 -
 130
130 -
 131
131 -
132
-
133
-
134
-
135
-
136
-
137
-
138
-
139
-
140
-
141
-
142
-
143
-
144
-
145
-
146
-
147
-
148
-
149
-
150
-
151
-
152
-
153
-
154
-
155
-
156
-
157
-
158
-
159
-
160
-
161
-
162
-
163
-
164
-
165
-
166
-
167
-
168
-
169
-
170
-
171
-
172
-
173
-
174
-
175
-
176
-
177
-
178
-
179
-
180
-
181
-
182
-
183
-
184
-
185
-
186
-
187
-
188
-
189
 |
 |

119
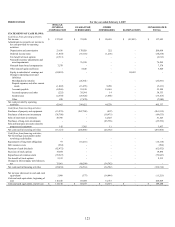
SUCCESSOR
March 6, 2007 through February 1, 2008
DOLLAR
GENERAL
CORPORATION
GUARANTOR
SUBSIDIARIES
OTHER
SUBSIDIARIES ELIMINATIONS
CONSOLIDATED
TOTAL
STATEMENTS OF CASH FLOWS:
Cash flows from operating activities:
Net income (loss)
$
(4,818)
$
127,632
$
16,598
$
(144,230)
$
(4,818)
Adjustments to reconcile net income to
net cash provided by (used in)
operating activities:
Depreciation and amortization 21,634
128,431
148
-
150,213
Deferred income taxes
(2,120)
20,208
1,463
-
19,551
Noncash inventory adjustments and
asset impairments
-
6,113
-
-
6,113
Noncash share-based compensation 3,827
- - - 3,827
Other noncash gains and losses
4,954
571
-
-
5,525
Equity in subsidiaries’ earnings, net (144,230)
-
-
144,230
-
Change in operating assets and
liabilities:
Merchandise inventories -
73,356
-
-
73,356
Prepaid expenses and other current
assets
(1,120)
4,783
76
-
3,739
Accounts payable (40,745)
12,428
(13,078)
-
(41,395)
Accrued expenses and other
(7,456)
6,418
17,099
-
16,061
Income taxes (45,416)
44,829
7,935
-
7,348
Other
(3,169)
3,675
(422)
-
84
Net cash provided by (used in)
operating activities
(218,659)
428,444
29,819
-
239,604
Cash flows from investing activities:
Merger, net of cash acquired (5,649,182)
(1,129,953)
40,744
-
(6,738,391)
Purchases of property and equipment
(1,617)
(82,003)
(21)
-
(83,641)
Purchases of short-term investments -
-
(3,800)
-
(3,800)
Sales of short-term investments
-
-
21,445
-
21,445
Purchases of long-term investments -
-
(7,473)
-
(7,473)
Purchase of promissory note
-
(37,047)
-
-
(37,047)
Proceeds from sale of property and
equipment -
533
-
-
533
Net cash provided by (used in)
investing activities
(5,650,799)
(1,248,470)
50,895
-
(6,848,374)
Cash flows from financing activities:
Issuance of common stock 2,759,540
- - - 2,759,540
Net borrowings (repayments) under
revolving credit facility
102,500
-
-
-
102,500
Issuance of long-term obligations 4,176,817
-
-
-
4,176,817
Repayments of long-term obligations
(236,084)
(5,861)
-
-
(241,945)
Debt issuance costs (87,392)
- - - (87,392)
Repurchase of common stock
(541)
-
-
-
(541)
Changes in intercompany note
balances, net (837,062)
885,266
(48,204)
-
-
Net cash provided by (used in)
financing activities
5,877,778
879,405
(48,204)
-
6,708,979
Net increase in cash and cash
equivalents 8,320
59,379
32,510
-
100,209
Cash and cash equivalents, beginning
of period
-
-
-
-
-
Cash and cash equivalents, end of year
$
8,320
$
59,379
$
32,510
$
-
$
100,209