Dollar General 2008 Annual Report Download - page 47
Download and view the complete annual report
Please find page 47 of the 2008 Dollar General annual report below. You can navigate through the pages in the report by either clicking on the pages listed below, or by using the keyword search tool below to find specific information within the annual report.-
 1
1 -
2
-
3
-
4
-
5
-
6
-
7
-
8
-
9
-
10
-
11
-
12
-
13
-
14
-
15
-
16
-
17
-
18
-
19
-
20
-
21
-
22
-
23
-
24
-
25
-
26
-
27
-
28
-
29
-
30
-
31
-
32
-
33
-
34
-
35
-
36
-
 37
37 -
 38
38 -
 39
39 -
 40
40 -
 41
41 -
 42
42 -
 43
43 -
 44
44 -
 45
45 -
 46
46 -
 47
47 -
 48
48 -
 49
49 -
 50
50 -
 51
51 -
 52
52 -
 53
53 -
 54
54 -
 55
55 -
 56
56 -
 57
57 -
58
-
59
-
60
-
61
-
62
-
63
-
64
-
65
-
66
-
67
-
68
-
69
-
70
-
71
-
72
-
73
-
74
-
75
-
76
-
77
-
78
-
79
-
80
-
81
-
82
-
83
-
84
-
85
-
86
-
87
-
88
-
89
-
90
-
91
-
92
-
93
-
94
-
95
-
96
-
97
-
98
-
99
-
100
-
101
-
102
-
103
-
104
-
105
-
106
-
107
-
108
-
109
-
110
-
111
-
112
-
113
-
114
-
115
-
116
-
117
-
118
-
119
-
120
-
121
-
122
-
123
-
124
-
125
-
126
-
127
-
128
-
129
-
130
-
131
-
132
-
133
-
134
-
135
-
136
-
137
-
138
-
139
-
140
-
141
-
142
-
143
-
144
-
145
-
146
-
147
-
148
-
149
-
150
-
151
-
152
-
153
-
154
-
155
-
156
-
157
-
158
-
159
-
160
-
161
-
162
-
163
-
164
-
165
-
166
-
167
-
168
-
169
-
170
-
171
-
172
-
173
-
174
-
175
-
176
-
177
-
178
-
179
-
180
-
181
-
182
-
183
-
184
-
185
-
186
-
187
-
188
-
189
 |
 |

45
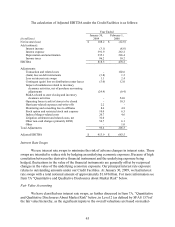
The calculation of Adjusted EBITDA under the Credit Facilities is as follows:
(in millions)
Year Ended
January 30,
2009
February 1,
2008
Net income (loss)
$
108.2
$
(12.8)
Add (subtract):
Interest income
(3.1)
(8.8)
Interest expense
391.9
263.2
Depreciation and amortization
235.1
226.4
Income taxes
86.2
10.2
EBITDA
818.3
478.2
Adjustments:
Transaction and related costs
-
102.6
(Gain) loss on debt retirements
(3.8)
1.2
Loss on interest rate swaps
1.1
2.4
Contingent (gain) loss on distribution center leases
(5.0)
12.0
Impact of markdowns related to inventory
clearance activities, net of purchase accounting
adjustments
(24.9)
(0.4)
SG&A related to store closing and inventory
clearance activities
-
54.0
Operating losses (cash) of stores to be closed
-
10.5
Hurricane-related expenses and write-offs
2.2
-
Monitoring and consulting fees to affiliates
8.6
4.8
Stock option and restricted stock unit expense
10.0
6.5
Indirect Merger-related costs
20.7
4.6
Litigation settlement and related costs, net
32.0
-
Other non-cash charges (primarily LIFO)
54.7
6.1
Other
-
1.0
Total Adjustments
95.6
205.3
Adjusted EBITDA
$
913.9
$
683.5
Interest Rate Swaps
We use interest rate swaps to minimize the risk of adverse changes in interest rates. These
swaps are intended to reduce risk by hedging an underlying economic exposure. Because of high
correlation between the derivative financial instrument and the underlying exposure being
hedged, fluctuations in the value of the financial instruments are generally offset by reciprocal
changes in the value of the underlying economic exposure. Our principal interest rate exposure
relates to outstanding amounts under our Credit Facilities. At January 30, 2009, we had interest
rate swaps with a total notional amount of approximately $1.69 billion. For more information see
Item 7A “Quantitative and Qualitative Disclosures about Market Risk” below.
Fair Value Accounting
We have classified our interest rate swaps, as further discussed in Item 7A. “Quantitative
and Qualitative Disclosures About Market Risk” below, in Level 2 (as defined by SFAS 157) of
the fair value hierarchy, as the significant inputs to the overall valuations are based on market-