Dollar General 2008 Annual Report Download - page 65
Download and view the complete annual report
Please find page 65 of the 2008 Dollar General annual report below. You can navigate through the pages in the report by either clicking on the pages listed below, or by using the keyword search tool below to find specific information within the annual report.-
 1
1 -
 2
2 -
 3
3 -
 4
4 -
 5
5 -
 6
6 -
 7
7 -
 8
8 -
 9
9 -
 10
10 -
 11
11 -
 12
12 -
 13
13 -
 14
14 -
 15
15 -
 16
16 -
 17
17 -
 18
18 -
 19
19 -
 20
20 -
 21
21 -
 22
22 -
 23
23 -
 24
24 -
 25
25 -
 26
26 -
 27
27 -
 28
28 -
 29
29 -
 30
30 -
 31
31 -
 32
32 -
 33
33 -
 34
34 -
 35
35 -
 36
36 -
 37
37 -
 38
38 -
 39
39 -
 40
40 -
 41
41 -
 42
42 -
 43
43 -
 44
44 -
 45
45 -
 46
46 -
 47
47 -
 48
48 -
 49
49 -
 50
50 -
 51
51 -
 52
52 -
 53
53 -
 54
54 -
 55
55 -
 56
56 -
 57
57 -
 58
58 -
 59
59 -
 60
60 -
 61
61 -
 62
62 -
 63
63 -
 64
64 -
 65
65 -
 66
66 -
 67
67 -
 68
68 -
 69
69 -
 70
70 -
 71
71 -
 72
72 -
 73
73 -
 74
74 -
 75
75 -
 76
76 -
 77
77 -
 78
78 -
 79
79 -
 80
80 -
 81
81 -
 82
82 -
 83
83 -
 84
84 -
 85
85 -
 86
86 -
 87
87 -
 88
88 -
 89
89 -
 90
90 -
 91
91 -
 92
92 -
 93
93 -
 94
94 -
 95
95 -
 96
96 -
 97
97 -
 98
98 -
 99
99 -
 100
100 -
 101
101 -
 102
102 -
 103
103 -
 104
104 -
 105
105 -
 106
106 -
 107
107 -
 108
108 -
 109
109 -
 110
110 -
 111
111 -
 112
112 -
 113
113 -
 114
114 -
 115
115 -
 116
116 -
 117
117 -
 118
118 -
 119
119 -
 120
120 -
 121
121 -
 122
122 -
 123
123 -
 124
124 -
 125
125 -
 126
126 -
 127
127 -
 128
128 -
 129
129 -
 130
130 -
 131
131 -
 132
132 -
 133
133 -
 134
134 -
 135
135 -
 136
136 -
 137
137 -
 138
138 -
 139
139 -
 140
140 -
 141
141 -
 142
142 -
 143
143 -
 144
144 -
 145
145 -
 146
146 -
 147
147 -
 148
148 -
 149
149 -
 150
150 -
 151
151 -
 152
152 -
 153
153 -
 154
154 -
 155
155 -
 156
156 -
 157
157 -
 158
158 -
 159
159 -
 160
160 -
 161
161 -
 162
162 -
 163
163 -
 164
164 -
 165
165 -
 166
166 -
 167
167 -
 168
168 -
 169
169 -
 170
170 -
 171
171 -
 172
172 -
 173
173 -
 174
174 -
 175
175 -
 176
176 -
 177
177 -
 178
178 -
 179
179 -
 180
180 -
 181
181 -
 182
182 -
 183
183 -
 184
184 -
 185
185 -
 186
186 -
 187
187 -
 188
188 -
 189
189
 |
 |

63
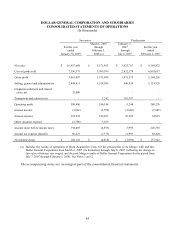
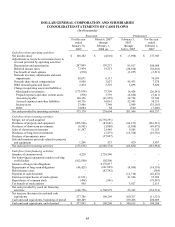
DOLLAR GENERAL CORPORATION AND SUBSIDIARIES
CONSOLIDATED STATEMENTS OF OPERATIONS
(In thousands)
Successor
Predecessor
For the year
ended
January 30, 2009
March 6, 2007
through
February 1,
2008 (a)
February 3,
2007
through
July 6, 2007
For the year
ended
February 2, 2007
Net sales
$
10,457,668
$
5,571,493
$
3,923,753
$
9,169,822
Cost of goods sold
7,396,571
3,999,599
2,852,178
6,801,617
Gross profit
3,061,097
1,571,894
1,071,575
2,368,205
Selling, general and administrative
2,448,611
1,324,508
960,930
2,119,929
Litigation settlement and related
costs, net 32,000 - - -
Transaction and related costs
-
1,242
101,397
-
Operating profit
580,486
246,144
9,248
248,276
Interest income
(3,061)
(3,799)
(5,046)
(7,002)
Interest expense
391,932
252,897
10,299
34,915
Other (income) expense
(2,788)
3,639
-
-
Income (loss) before income taxes
194,403
(6,593)
3,995
220,363
Income tax expense (benefit)
86,221
(1,775)
11,993
82,420
Net income (loss)
$
108,182
$
(4,818)
$
(7,998)
$
137,943
(a) Includes the results of operations of Buck Acquisition Corp. for the period prior to its Merger with and into
Dollar General Corporation from March 6, 2007 (its formation) through July 6, 2007 (reflecting the change in
fair value of interest rate swaps), and the post-Merger results of Dollar General Corporation for the period from
July 7, 2007 through February 1, 2008. See Notes 1 and 2.
The accompanying notes are an integral part of the consolidated financial statements.
