Dollar General 2008 Annual Report Download - page 122
Download and view the complete annual report
Please find page 122 of the 2008 Dollar General annual report below. You can navigate through the pages in the report by either clicking on the pages listed below, or by using the keyword search tool below to find specific information within the annual report.-
 1
1 -
2
-
3
-
4
-
5
-
6
-
7
-
8
-
9
-
10
-
11
-
12
-
13
-
14
-
15
-
16
-
17
-
18
-
19
-
20
-
21
-
22
-
23
-
24
-
25
-
26
-
27
-
28
-
29
-
30
-
31
-
32
-
33
-
34
-
35
-
36
-
37
-
38
-
39
-
40
-
41
-
42
-
43
-
44
-
45
-
46
-
47
-
48
-
49
-
50
-
51
-
52
-
53
-
54
-
55
-
56
-
57
-
58
-
59
-
60
-
61
-
62
-
63
-
64
-
65
-
66
-
67
-
68
-
69
-
70
-
71
-
72
-
73
-
74
-
75
-
76
-
77
-
78
-
79
-
80
-
81
-
82
-
83
-
84
-
85
-
86
-
87
-
88
-
89
-
90
-
91
-
92
-
93
-
94
-
95
-
96
-
97
-
98
-
99
-
100
-
101
-
102
-
103
-
104
-
105
-
106
-
107
-
108
-
109
-
110
-
111
-
 112
112 -
 113
113 -
 114
114 -
 115
115 -
 116
116 -
 117
117 -
 118
118 -
 119
119 -
 120
120 -
 121
121 -
 122
122 -
 123
123 -
 124
124 -
 125
125 -
 126
126 -
 127
127 -
 128
128 -
 129
129 -
 130
130 -
 131
131 -
 132
132 -
133
-
134
-
135
-
136
-
137
-
138
-
139
-
140
-
141
-
142
-
143
-
144
-
145
-
146
-
147
-
148
-
149
-
150
-
151
-
152
-
153
-
154
-
155
-
156
-
157
-
158
-
159
-
160
-
161
-
162
-
163
-
164
-
165
-
166
-
167
-
168
-
169
-
170
-
171
-
172
-
173
-
174
-
175
-
176
-
177
-
178
-
179
-
180
-
181
-
182
-
183
-
184
-
185
-
186
-
187
-
188
-
189
 |
 |

120
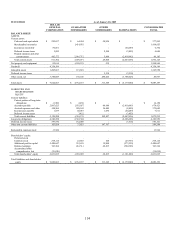
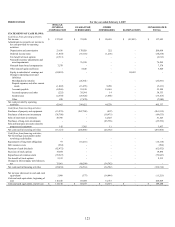
PREDECESSOR
February 3, 2007 through July 6, 2007
DOLLAR
GENERAL
CORPORATION
GUARANTOR
SUBSIDIARIES
OTHER
SUBSIDIARIES ELIMINATIONS
CONSOLIDATED
TOTAL
STATEMENTS OF CASH FLOWS:
Cash flows from operating activities:
Net income (loss)
$
(7,998)
$
32,974
$
10,011
$
(42,985)
$
(7,998)
Adjustments to reconcile net income
(loss) to net cash provided by
operating activities:
Depreciation and amortization 9,051
74,770 96 - 83,917
Deferred income taxes
(7,982)
(9,194)
(3,698)
-
(20,874)
Tax benefit of stock options (3,927)
- - - (3,927)
Noncash share-based compensation
45,433
-
-
-
45,433
Other noncash gains and losses -
5,098 - - 5,098
Equity in subsidiaries’ earnings, net
(42,985)
-
-
42,985
-
Change in operating assets and
liabilities:
Merchandise inventories -
16,424 - - 16,424
Prepaid expenses and other current
assets
5,758
(11,762)
(180)
-
(6,184)
Accounts payable 44,909
(23,103) 12,988 - 34,794
Accrued expenses and other
7,897
36,021
9,077
-
52,995
Income taxes (24,998)
31,741 (3,934) - 2,809
Other
21
(372)
(190)
-
(541)
Net cash provided by operating
activities
25,179
152,597
24,170
-
201,946
Cash flows from investing activities:
Purchases of property and equipment (5,321)
(50,737) (95) - (56,153)
Purchases of short-term investments
-
-
(5,100)
-
(5,100)
Sales of short-term investments -
- 9,505 - 9,505
Purchases of long-term investments
-
-
(15,754)
-
(15,754)
Proceeds from sale of property and
equipment - 620 - - 620
Net cash used in investing activities (5,321)
(50,117) (11,444) - (66,882)
Cash flows from financing activities:
Repayments of long-term obligations
(148)
(4,352)
-
-
(4,500)
Payment of cash dividends (15,710)
- - - (15,710)
Proceeds from exercise of stock options
41,546
-
-
-
41,546
Tax benefit of stock options 3,927
- - - 3,927
Changes in intercompany note balances,
net
75,840
(86,988)
11,148
-
-
Net cash provided by (used in)
financing activities 105,455 (91,340) 11,148 - 25,263
Net increase in cash and cash
equivalents
125,313
11,140
23,874
-
160,327
Cash and cash equivalents, beginning of
year 114,310 58,107 16,871 - 189,288
Cash and cash equivalents, end of
period $ 239,623 $ 69,247 $ 40,745 $ - $ 349,615