Dollar General 2008 Annual Report Download - page 117
Download and view the complete annual report
Please find page 117 of the 2008 Dollar General annual report below. You can navigate through the pages in the report by either clicking on the pages listed below, or by using the keyword search tool below to find specific information within the annual report.-
 1
1 -
2
-
3
-
4
-
5
-
6
-
7
-
8
-
9
-
10
-
11
-
12
-
13
-
14
-
15
-
16
-
17
-
18
-
19
-
20
-
21
-
22
-
23
-
24
-
25
-
26
-
27
-
28
-
29
-
30
-
31
-
32
-
33
-
34
-
35
-
36
-
37
-
38
-
39
-
40
-
41
-
42
-
43
-
44
-
45
-
46
-
47
-
48
-
49
-
50
-
51
-
52
-
53
-
54
-
55
-
56
-
57
-
58
-
59
-
60
-
61
-
62
-
63
-
64
-
65
-
66
-
67
-
68
-
69
-
70
-
71
-
72
-
73
-
74
-
75
-
76
-
77
-
78
-
79
-
80
-
81
-
82
-
83
-
84
-
85
-
86
-
87
-
88
-
89
-
90
-
91
-
92
-
93
-
94
-
95
-
96
-
97
-
98
-
99
-
100
-
101
-
102
-
103
-
104
-
105
-
106
-
 107
107 -
 108
108 -
 109
109 -
 110
110 -
 111
111 -
 112
112 -
 113
113 -
 114
114 -
 115
115 -
 116
116 -
 117
117 -
 118
118 -
 119
119 -
 120
120 -
 121
121 -
 122
122 -
 123
123 -
 124
124 -
 125
125 -
 126
126 -
 127
127 -
128
-
129
-
130
-
131
-
132
-
133
-
134
-
135
-
136
-
137
-
138
-
139
-
140
-
141
-
142
-
143
-
144
-
145
-
146
-
147
-
148
-
149
-
150
-
151
-
152
-
153
-
154
-
155
-
156
-
157
-
158
-
159
-
160
-
161
-
162
-
163
-
164
-
165
-
166
-
167
-
168
-
169
-
170
-
171
-
172
-
173
-
174
-
175
-
176
-
177
-
178
-
179
-
180
-
181
-
182
-
183
-
184
-
185
-
186
-
187
-
188
-
189
 |
 |
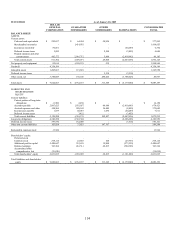
115
SUCCESSOR
As of February 1, 2008
DOLLAR
GENERAL
CORPORATION
GUARANTOR
SUBSIDIARIES
OTHER
SUBSIDIARIES ELIMINATIONS
CONSOLIDATED
TOTAL
BALANCE SHEET:
ASSETS
Current assets:
Cash and cash equivalents
$
8,320
$
59,379
$
32,510
$
-
$
100,209
Short-term investments -
-
19,611
-
19,611
Merchandise inventories
-
1,288,661
-
-
1,288,661
Income tax receivable 102,273
-
-
(69,772)
32,501
Deferred income taxes
3,966
-
20,626
(7,295)
17,297
Prepaid expenses and other
current assets 221,408
337,741
9,341
(509,025)
59,465
Total current assets 335,967
1,685,781
82,088
(586,092)
1,517,744
Net property and equipment 83,658
1,190,131
456
-
1,274,245
Goodwill 4,344,930
-
-
-
4,344,930
Intangible assets 10,911
1,359,646
-
-
1,370,557
Deferred income taxes 43,890
-
47,067
(90,957)
-
Other assets, net 2,629,967
1,652
111,597
(2,594,261)
148,955
Total assets
$
7,449,323
$
4,237,210
$
241,208
$
(3,271,310)
$
8,656,431
LIABILITIES AND
SHAREHOLDERS’
EQUITY
Current liabilities:
Current portion of long-term
obligations
$
-
$
3,246
$
-
$
-
$
3,246
Accounts payable
253,477
736,844
40
(439,321)
551,040
Accrued expenses and other 62,957 188,877 55,185 (6,063) 300,956
Income taxes payable
-
59,264
13,507
(69,772)
2,999
Total current liabilities 316,434 988,231 68,732 (515,156) 858,241
Long-term obligations
4,257,250
1,837,715
-
(1,816,209)
4,278,756
Deferred income taxes
-
584,976
-
(98,251)
486,725
Other liabilities 162,644 21,191 135,879 - 319,714
Redeemable common stock 9,122 - - - 9,122
Shareholders’ equity:
Preferred stock
-
-
-
-
-
Common stock
277,741
23,753
100
(23,853)
277,741
Additional paid-in capital
2,480,062
653,711
19,900
(673,611)
2,480,062
Retained earnings
(4,818)
127,633
16,597
(144,230)
(4,818)
Accumulated other
comprehensive loss (49,112)
-
-
-
(49,112)
Total shareholders’ equity
2,703,873
805,097
36,597
(841,694)
2,703,873
Total liabilities and shareholders’
equity
$
7,449,323
$
4,237,210
$
241,208
$
(3,271,310)
$
8,656,431