Dollar General 2008 Annual Report Download - page 116
Download and view the complete annual report
Please find page 116 of the 2008 Dollar General annual report below. You can navigate through the pages in the report by either clicking on the pages listed below, or by using the keyword search tool below to find specific information within the annual report.-
 1
1 -
2
-
3
-
4
-
5
-
6
-
7
-
8
-
9
-
10
-
11
-
12
-
13
-
14
-
15
-
16
-
17
-
18
-
19
-
20
-
21
-
22
-
23
-
24
-
25
-
26
-
27
-
28
-
29
-
30
-
31
-
32
-
33
-
34
-
35
-
36
-
37
-
38
-
39
-
40
-
41
-
42
-
43
-
44
-
45
-
46
-
47
-
48
-
49
-
50
-
51
-
52
-
53
-
54
-
55
-
56
-
57
-
58
-
59
-
60
-
61
-
62
-
63
-
64
-
65
-
66
-
67
-
68
-
69
-
70
-
71
-
72
-
73
-
74
-
75
-
76
-
77
-
78
-
79
-
80
-
81
-
82
-
83
-
84
-
85
-
86
-
87
-
88
-
89
-
90
-
91
-
92
-
93
-
94
-
95
-
96
-
97
-
98
-
99
-
100
-
101
-
102
-
103
-
104
-
105
-
 106
106 -
 107
107 -
 108
108 -
 109
109 -
 110
110 -
 111
111 -
 112
112 -
 113
113 -
 114
114 -
 115
115 -
 116
116 -
 117
117 -
 118
118 -
 119
119 -
 120
120 -
 121
121 -
 122
122 -
 123
123 -
 124
124 -
 125
125 -
 126
126 -
127
-
128
-
129
-
130
-
131
-
132
-
133
-
134
-
135
-
136
-
137
-
138
-
139
-
140
-
141
-
142
-
143
-
144
-
145
-
146
-
147
-
148
-
149
-
150
-
151
-
152
-
153
-
154
-
155
-
156
-
157
-
158
-
159
-
160
-
161
-
162
-
163
-
164
-
165
-
166
-
167
-
168
-
169
-
170
-
171
-
172
-
173
-
174
-
175
-
176
-
177
-
178
-
179
-
180
-
181
-
182
-
183
-
184
-
185
-
186
-
187
-
188
-
189
 |
 |

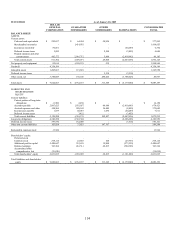
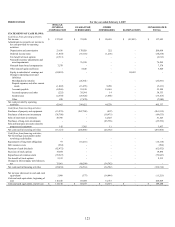
114
SUCCESSOR
As of January 30, 2009
DOLLAR
GENERAL
CORPORATION
GUARANTOR
SUBSIDIARIES
OTHER
SUBSIDIARIES ELIMINATIONS
CONSOLIDATED
TOTAL
BALANCE SHEET:
ASSETS
Current assets:
Cash and cash equivalents
$
292,637
$
64,404
$
20,954
$
-
$
377,995
Merchandise inventories -
1,414,955 - - 1,414,955
Income tax receivable
50,601
-
-
(44,209)
6,392
Deferred income taxes 5,892
-
2,560
(3,852)
4,600
Prepaid expenses and other
current assets
462,572
2,016,712
5,894
(2,418,995)
66,183
Total current assets
811,702
3,496,071
29,408
(2,467,056)
1,870,125
Net property and equipment
82,616
1,186,125
219
-
1,268,960
Goodwill
4,338,589
-
-
-
4,338,589
Intangible assets 1,205,667
119,891
-
-
1,325,558
Deferred income taxes
-
-
3,518
(3,518)
-
Other assets, net
3,384,089
130,100
280,204
(3,708,426)
85,967
Total assets
$
9,822,663
$
4,932,187
$
313,349
$
(6,179,000)
$
8,889,199
LIABILITIES AND
SHAREHOLDERS’
EQUITY
Current liabilities:
Current portion of long-term
obligations
$
11,500
$
2,658
$
-
$
-
$
14,158
Accounts payable
2,007,625
1,035,057
46,644
(2,410,905)
678,421
Accrued expenses and other 108,504 220,142 54,489 (8,090) 375,045
Income taxes payable
1,659
48,467
1,694
(44,209)
7,611
Deferred income taxes
-
3,852
-
(3,852)
-
Total current liabilities
2,129,288
1,310,176
102,827
(2,467,056)
1,075,235
Long-term obligations
4,346,258
2,383,304
-
(2,606,606)
4,122,956
Deferred income taxes
397,570
162,049
-
(3,518)
556,101
Other non-current liabilities
103,928
37,653
147,707
-
289,288
Redeemable common stock
13,924
-
-
-
13,924
Shareholders’ equity:
Preferred stock
-
-
-
-
-
Common stock
278,114
23,855
100
(23,955)
278,114
Additional paid-in capital
2,489,647
553,639
19,900
(573,539)
2,489,647
Retained earnings
103,364
461,511
42,815
(504,326)
103,364
Accumulated other
comprehensive loss (39,430)
-
-
-
(39,430)
Total shareholders’ equity
2,831,695
1,039,005
62,815
(1,101,820)
2,831,695
Total liabilities and shareholders’
equity $ 9,822,663
$ 4,932,187
$ 313,349
$ (6,179,000)
$ 8,889,199