Dollar General 2008 Annual Report Download - page 67
Download and view the complete annual report
Please find page 67 of the 2008 Dollar General annual report below. You can navigate through the pages in the report by either clicking on the pages listed below, or by using the keyword search tool below to find specific information within the annual report.-
 1
1 -
2
-
3
-
4
-
5
-
6
-
7
-
8
-
9
-
10
-
11
-
12
-
13
-
14
-
15
-
16
-
17
-
18
-
19
-
20
-
21
-
22
-
23
-
24
-
25
-
26
-
27
-
28
-
29
-
30
-
31
-
32
-
33
-
34
-
35
-
36
-
37
-
38
-
39
-
40
-
41
-
42
-
43
-
44
-
45
-
46
-
47
-
48
-
49
-
50
-
51
-
52
-
53
-
54
-
55
-
56
-
 57
57 -
 58
58 -
 59
59 -
 60
60 -
 61
61 -
 62
62 -
 63
63 -
 64
64 -
 65
65 -
 66
66 -
 67
67 -
 68
68 -
 69
69 -
 70
70 -
 71
71 -
 72
72 -
 73
73 -
 74
74 -
 75
75 -
 76
76 -
 77
77 -
78
-
79
-
80
-
81
-
82
-
83
-
84
-
85
-
86
-
87
-
88
-
89
-
90
-
91
-
92
-
93
-
94
-
95
-
96
-
97
-
98
-
99
-
100
-
101
-
102
-
103
-
104
-
105
-
106
-
107
-
108
-
109
-
110
-
111
-
112
-
113
-
114
-
115
-
116
-
117
-
118
-
119
-
120
-
121
-
122
-
123
-
124
-
125
-
126
-
127
-
128
-
129
-
130
-
131
-
132
-
133
-
134
-
135
-
136
-
137
-
138
-
139
-
140
-
141
-
142
-
143
-
144
-
145
-
146
-
147
-
148
-
149
-
150
-
151
-
152
-
153
-
154
-
155
-
156
-
157
-
158
-
159
-
160
-
161
-
162
-
163
-
164
-
165
-
166
-
167
-
168
-
169
-
170
-
171
-
172
-
173
-
174
-
175
-
176
-
177
-
178
-
179
-
180
-
181
-
182
-
183
-
184
-
185
-
186
-
187
-
188
-
189
 |
 |

65
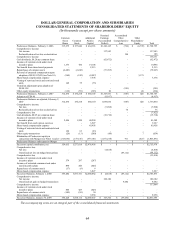
DOLLAR GENERAL CORPORATION AND SUBSIDIARIES
CONSOLIDATED STATEMENTS OF CASH FLOWS
(In thousands)
Successor
Predecessor
For the year
ended
January 30,
2009
March 6, 2007
through
February 1,
2008 (a)
February 3,
2007
through
July 6, 2007
For the year
ended
February 2,
2007
Cash flows from operating activities:
Net income (loss)
$
108,182
$
(4,818)
$
(7,998)
$
137,943
Adjustments to reconcile net income (loss) to
net cash provided by operating activities:
Depreciation and amortization
247,899
150,213
83,917
200,608
Deferred income taxes
73,434
19,551
(20,874)
(38,218)
Tax benefit of stock options
(950)
-
(3,927)
(2,513)
Noncash inventory adjustments and asset
impairments
50,671 6,113
-
76,599
Noncash share-based compensation
9,958
3,827
45,433
7,578
Other noncash gains and losses
2,434
5,525
5,098
5,820
Change in operating assets and liabilities:
Merchandise inventories
(173,014)
73,356
16,424
(26,541)
Prepaid expenses and other current assets
(598)
3,739
(6,184)
(5,411)
Accounts payable
140,356
(41,395)
34,794
53,544
Accrued expenses and other liabilities
68,736
16,061
52,995
38,353
Income taxes
33,986
7,348
2,809
(35,165)
Other
14,084
84
(541)
(7,240)
Net cash provided by operating activities
575,178
239,604
201,946
405,357
Cash flows from investing activities:
Merger, net of cash acquired
-
(6,738,391)
-
-
Purchases of property and equipment
(205,546)
(83,641)
(56,153)
(261,515)
Purchases of short-term investments
(9,903)
(3,800)
(5,100)
(49,675)
Sales of short-term investments
61,547
21,445
9,505
51,525
Purchases of long-term investments
-
(7,473)
(15,754)
(25,756)
Purchase of promissory notes
-
(37,047)
-
-
Sale and insurance proceeds related to property
and equipment
1,266
533
620
3,457
Net cash used in investing activities
(152,636)
(6,848,374)
(66,882)
(281,964)
Cash flows from financing activities:
Issuance of common stock
4,228
2,759,540
-
-
Net borrowings (repayments) under revolving
credit facility
(102,500)
102,500
-
-
Issuance of long-term obligations
-
4,176,817
-
-
Repayments of long-term obligations
(44,425)
(241,945)
(4,500)
(14,118)
Debt issuance costs
-
(87,392)
-
(584)
Payment of cash dividends
-
-
(15,710)
(62,472)
Exercises (repurchases) of stock options
(2,511)
-
41,546
19,894
Repurchases of common stock
(498)
(541)
-
(79,947)
Tax benefit of stock options
950
-
3,927
2,513
Net cash provided by (used in) financing
activities
(144,756) 6,708,979
25,263
(134,714)
Net increase (decrease) in cash and cash
equivalents
277,786
100,209
160,327
(11,321)
Cash and cash equivalents, beginning of period
100,209
-
189,288
200,609
Cash and cash equivalents, end of period
$
377,995
$
100,209
$
349,615
$
189,288