Dollar General 2008 Annual Report Download - page 38
Download and view the complete annual report
Please find page 38 of the 2008 Dollar General annual report below. You can navigate through the pages in the report by either clicking on the pages listed below, or by using the keyword search tool below to find specific information within the annual report.-
 1
1 -
2
-
3
-
4
-
5
-
6
-
7
-
8
-
9
-
10
-
11
-
12
-
13
-
14
-
15
-
16
-
17
-
18
-
19
-
20
-
21
-
22
-
23
-
24
-
25
-
26
-
27
-
 28
28 -
 29
29 -
 30
30 -
 31
31 -
 32
32 -
 33
33 -
 34
34 -
 35
35 -
 36
36 -
 37
37 -
 38
38 -
 39
39 -
 40
40 -
 41
41 -
 42
42 -
 43
43 -
 44
44 -
 45
45 -
 46
46 -
 47
47 -
 48
48 -
49
-
50
-
51
-
52
-
53
-
54
-
55
-
56
-
57
-
58
-
59
-
60
-
61
-
62
-
63
-
64
-
65
-
66
-
67
-
68
-
69
-
70
-
71
-
72
-
73
-
74
-
75
-
76
-
77
-
78
-
79
-
80
-
81
-
82
-
83
-
84
-
85
-
86
-
87
-
88
-
89
-
90
-
91
-
92
-
93
-
94
-
95
-
96
-
97
-
98
-
99
-
100
-
101
-
102
-
103
-
104
-
105
-
106
-
107
-
108
-
109
-
110
-
111
-
112
-
113
-
114
-
115
-
116
-
117
-
118
-
119
-
120
-
121
-
122
-
123
-
124
-
125
-
126
-
127
-
128
-
129
-
130
-
131
-
132
-
133
-
134
-
135
-
136
-
137
-
138
-
139
-
140
-
141
-
142
-
143
-
144
-
145
-
146
-
147
-
148
-
149
-
150
-
151
-
152
-
153
-
154
-
155
-
156
-
157
-
158
-
159
-
160
-
161
-
162
-
163
-
164
-
165
-
166
-
167
-
168
-
169
-
170
-
171
-
172
-
173
-
174
-
175
-
176
-
177
-
178
-
179
-
180
-
181
-
182
-
183
-
184
-
185
-
186
-
187
-
188
-
189
 |
 |

36
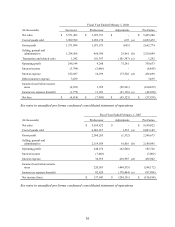
Fiscal Year Ended February 1, 2008
(In thousands)
Successor
Predecessor
Adjustments
Pro Forma
Net sales
$
5,571,493
$
3,923,753
$
-
$
9,495,246
Cost of goods sold 3,999,599 2,852,178 695 (a) 6,852,472
Gross profit 1,571,894 1,071,575 (695) 2,642,774
Selling, general and
administrative
1,324,508
960,930
25,461
(b)
2,310,899
Transaction and related costs
1,242
101,397
(101,397)
(c)
1,242
Operating profit
246,144
9,248
75,241
330,633
Interest income
(3,799)
(5,046)
-
(8,845)
Interest expense
252,897
10,299
173,502
(d)
436,698
Other (income) expense 3,639 - - 3,639
Income (loss) before income
taxes
(6,593)
3,995
(98,261)
(100,859)
Income tax expense (benefit)
(1,775)
11,993
(53,138)
(e)
(42,920)
Net loss
$
(4,818)
$
(7,998)
$
(45,123)
$
(57,939)
See notes to unaudited pro forma condensed consolidated statement of operations
Fiscal Year Ended February 2, 2007
(In thousands)
Predecessor
Adjustments
Pro Forma
Net sales
$
9,169,822
$
-
$
9,169,822
Cost of goods sold 6,801,617 1,532 (a) 6,803,149
Gross profit 2,368,205 (1,532) 2,366,673
Selling, general and
administrative 2,119,929 61,016 (b) 2,180,945
Operating profit 248,276 (62,548) 185,728
Interest income
(7,002)
-
(7,002)
Interest expense 34,915 401,987 (d) 436,902
Income (loss) before income
taxes
220,363
(464,535)
(244,172)
Income tax expense (benefit) 82,420 (170,404) (e) (87,984)
Net income (loss) $
137,943 $
(294,131) $
(156,188)
See notes to unaudited pro forma condensed consolidated statement of operations