Dollar General 2008 Annual Report Download - page 66
Download and view the complete annual report
Please find page 66 of the 2008 Dollar General annual report below. You can navigate through the pages in the report by either clicking on the pages listed below, or by using the keyword search tool below to find specific information within the annual report.-
 1
1 -
2
-
3
-
4
-
5
-
6
-
7
-
8
-
9
-
10
-
11
-
12
-
13
-
14
-
15
-
16
-
17
-
18
-
19
-
20
-
21
-
22
-
23
-
24
-
25
-
26
-
27
-
28
-
29
-
30
-
31
-
32
-
33
-
34
-
35
-
36
-
37
-
38
-
39
-
40
-
41
-
42
-
43
-
44
-
45
-
46
-
47
-
48
-
49
-
50
-
51
-
52
-
53
-
54
-
55
-
 56
56 -
 57
57 -
 58
58 -
 59
59 -
 60
60 -
 61
61 -
 62
62 -
 63
63 -
 64
64 -
 65
65 -
 66
66 -
 67
67 -
 68
68 -
 69
69 -
 70
70 -
 71
71 -
 72
72 -
 73
73 -
 74
74 -
 75
75 -
 76
76 -
77
-
78
-
79
-
80
-
81
-
82
-
83
-
84
-
85
-
86
-
87
-
88
-
89
-
90
-
91
-
92
-
93
-
94
-
95
-
96
-
97
-
98
-
99
-
100
-
101
-
102
-
103
-
104
-
105
-
106
-
107
-
108
-
109
-
110
-
111
-
112
-
113
-
114
-
115
-
116
-
117
-
118
-
119
-
120
-
121
-
122
-
123
-
124
-
125
-
126
-
127
-
128
-
129
-
130
-
131
-
132
-
133
-
134
-
135
-
136
-
137
-
138
-
139
-
140
-
141
-
142
-
143
-
144
-
145
-
146
-
147
-
148
-
149
-
150
-
151
-
152
-
153
-
154
-
155
-
156
-
157
-
158
-
159
-
160
-
161
-
162
-
163
-
164
-
165
-
166
-
167
-
168
-
169
-
170
-
171
-
172
-
173
-
174
-
175
-
176
-
177
-
178
-
179
-
180
-
181
-
182
-
183
-
184
-
185
-
186
-
187
-
188
-
189
 |
 |

64
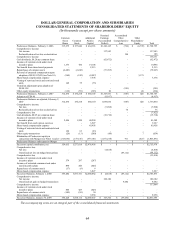
DOLLAR GENERAL CORPORATION AND SUBSIDIARIES
CONSOLIDATED STATEMENTS OF SHAREHOLDERS’ EQUITY
(In thousands except per share amounts)
Common
Stock
Shares
Common
Stock
Additional
Paid-in
Capital
Retained
Earnings
(Accumulated
Deficit)
Accumulated
Other
Comprehensive
Loss
Other
Shareholders’
Equity Total
Predecessor Balances, February 3, 2006
315,679
$ 157,840
$ 462,383
$1,106,165
$ (794)
$ (4,799)
$1,720,795
Comprehensive income:
Net income
-
-
-
137,943
-
-
137,943
Reclassification of net loss on derivatives
-
-
-
-
188
-
188
Comprehensive income
138,131
Cash dividends, $0.20 per common share
-
-
-
(62,472)
-
-
(62,472)
Issuance of common stock under stock
incentive plans
1,573
786
19,108
-
-
-
19,894
Tax benefit from share-based payments
-
-
2,513
-
-
-
2,513
Repurchases of common stock
(4,483)
(2,242)
-
(77,705)
-
-
(79,947)
Reversal of unearned compensation upon
adoption of SFAS 123(R) (see Note 10)
(364)
(182)
(4,997)
-
-
5,179
-
Share-based compensation expense
-
-
7,578
-
-
-
7,578
Vesting of restricted stock and restricted stock
units 149 75 (75) - - - -
Transition adjustment upon adoption of
SFAS 158
-
-
-
-
(381)
-
(381)
Other equity transactions
(118)
(59)
(365)
20
-
40
(364)
Predecessor Balances, February 2, 2007
312,436
$ 156,218
$ 486,145
$1,103,951
$ (987)
$ 420
$1,745,747
Adoption of FIN 48
-
-
-
(8,917)
-
-
(8,917)
Predecessor Balances as adjusted, February 2,
2007
312,436
156,218
486,145
1,095,034
(987)
420
1,736,830
Comprehensive income:
Net loss
-
-
-
(7,998)
-
-
(7,998)
Reclassification of net loss on derivatives
-
-
-
-
76
-
76
Comprehensive loss
-
-
-
-
-
-
(7,922)
Cash dividends, $0.05 per common share - - - (15,710) - - (15,710)
Issuance of common stock under stock
incentive plans 2,496 1,248 40,294 - - - 41,542
Tax benefit from stock option exercises
-
-
3,927
-
-
-
3,927
Share-based compensation expense
-
-
45,458
-
-
-
45,458
Vesting of restricted stock and restricted stock
units 126 63 (63) - - - -
Other equity transactions
(28)
(13)
(580)
(48)
-
7
(634)
Elimination of Predecessor equity in
connection with Merger (see Notes 1 and 2)
(315,030)
(157,516)
(575,181)
(1,071,278)
911
(427)
(1,803,491)
Predecessor Balances subsequent to Merger
-
$ -
$ -
$ -
$ -
$ -
$ -
Successor capital contribution, net
554,035
$277,018
$2,476,958
$ -
$ -
$ -
$2,753,976
Comprehensive loss:
Net loss
-
-
-
(4,818)
-
-
(4,818)
Unrealized net loss on hedged transactions - - - - (49,112) -
(49,112)
Comprehensive loss
(53,930)
Issuance of common stock under stock
incentive plans
574
287
(287)
-
-
-
-
Issuance of restricted common stock under
stock incentive plans 890 445 (445) - - - -
Repurchases of common stock
(17)
(9)
9
-
-
-
-
Share-based compensation expense
-
-
3,827
-
-
-
3,827
Successor Balances, February 1, 2008
555,482
$277,741
$2,480,062
$ (4,818)
$ (49,112)
$ -
$2,703,873
Comprehensive income:
Net income
-
-
-
108,182
-
-
108,182
Unrealized net gain on hedged transactions - - - - 9,682 -
9,682
Comprehensive income
117,864
Issuance of common stock under stock
incentive plans 846 423 (423) - - - -
Repurchases of common stock
(100)
(50)
50
-
-
-
-
Share-based compensation expense
-
-
9,958
-
-
-
9,958
Successor Balances, January 30, 2009 556,228 $278,114 $2,489,647 $ 103,364 $ (39,430) $ - $2,831,695
The accompanying notes are an integral part of the consolidated financial statements.