Dollar General 2008 Annual Report Download - page 114
Download and view the complete annual report
Please find page 114 of the 2008 Dollar General annual report below. You can navigate through the pages in the report by either clicking on the pages listed below, or by using the keyword search tool below to find specific information within the annual report.-
 1
1 -
2
-
3
-
4
-
5
-
6
-
7
-
8
-
9
-
10
-
11
-
12
-
13
-
14
-
15
-
16
-
17
-
18
-
19
-
20
-
21
-
22
-
23
-
24
-
25
-
26
-
27
-
28
-
29
-
30
-
31
-
32
-
33
-
34
-
35
-
36
-
37
-
38
-
39
-
40
-
41
-
42
-
43
-
44
-
45
-
46
-
47
-
48
-
49
-
50
-
51
-
52
-
53
-
54
-
55
-
56
-
57
-
58
-
59
-
60
-
61
-
62
-
63
-
64
-
65
-
66
-
67
-
68
-
69
-
70
-
71
-
72
-
73
-
74
-
75
-
76
-
77
-
78
-
79
-
80
-
81
-
82
-
83
-
84
-
85
-
86
-
87
-
88
-
89
-
90
-
91
-
92
-
93
-
94
-
95
-
96
-
97
-
98
-
99
-
100
-
101
-
102
-
103
-
 104
104 -
 105
105 -
 106
106 -
 107
107 -
 108
108 -
 109
109 -
 110
110 -
 111
111 -
 112
112 -
 113
113 -
 114
114 -
 115
115 -
 116
116 -
 117
117 -
 118
118 -
 119
119 -
 120
120 -
 121
121 -
 122
122 -
 123
123 -
 124
124 -
125
-
126
-
127
-
128
-
129
-
130
-
131
-
132
-
133
-
134
-
135
-
136
-
137
-
138
-
139
-
140
-
141
-
142
-
143
-
144
-
145
-
146
-
147
-
148
-
149
-
150
-
151
-
152
-
153
-
154
-
155
-
156
-
157
-
158
-
159
-
160
-
161
-
162
-
163
-
164
-
165
-
166
-
167
-
168
-
169
-
170
-
171
-
172
-
173
-
174
-
175
-
176
-
177
-
178
-
179
-
180
-
181
-
182
-
183
-
184
-
185
-
186
-
187
-
188
-
189
 |
 |

112
Successor
Predecessor
(In thousands)
2008
March 6, 2007
through
February 1, 2008
February 3, 2007
through
July 6, 2007
2006
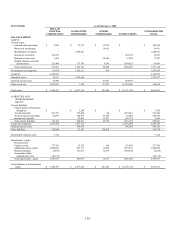
Classes of similar products:
Highly consumable
$
7,248,418
$
3,701,724
$
2,615,110
$
6,022,014
Seasonal
1,521,450
908,301
604,935
1,509,999
Home products
862,226
507,027
362,725
914,357
Basic clothing
825,574
454,441
340,983
723,452
Net sales
$
10,457,668
$
5,571,493
$
3,923,753
$
9,169,822
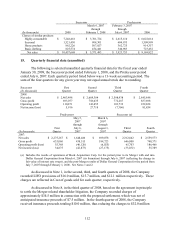
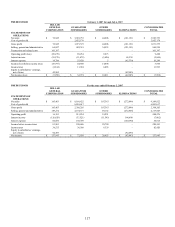
15. Quarterly financial data (unaudited)
The following is selected unaudited quarterly financial data for the fiscal year ended
January 30, 2009, the Successor period ended February 1, 2008, and the Predecessor period
ended July 6, 2007. Each quarterly period listed below was a 13-week accounting period. The
sum of the four quarters for any given year may not equal annual totals due to rounding.
Successor
(In thousands)
First
Quarter
Second
Quarter
Third
Quarter
Fourth
Quarter
2008:
Net sales
$
2,403,498
$
2,609,384
$
2,598,938
$
2,845,848
Gross profit
693,077
758,035
772,287
837,698
Operating profit
110,871
143,055
103,732
222,828
Net income (loss)
5,916
27,718
(7,306)
81,854
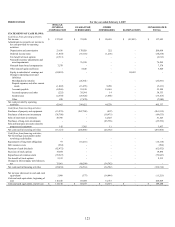
Predecessor
Successor (a)
(In thousands
)
First
Quarter
May 5,
2007
through
July 6,
2007
March 6,
2007
through
August 3,
2007
Third
Quarter
Fourth
Quarter
2007:
Net sales
$
2,275,267
$
1,648,486
$
699,078
$
2,312,842
$
2,559,573
Gross profit
633,060
438,515
184,723
646,800
740,371
Operating profit (loss)
55,368
(46,120)
(6,025)
65,703
186,466
Net income (loss)
34,875
(42,873)
(27,175)
(33,032)
55,389
(a) Includes the results of operations of Buck Acquisition Corp. for the period prior to its Merger with and into
Dollar General Corporation from March 6, 2007 (its formation) through July 6, 2007 (reflecting the change in
fair value of interest rate swaps), and the post-Merger results of Dollar General Corporation for the period from
July 7, 2007 through February 1, 2008. See Notes 1 and 2.
As discussed in Note 1, in the second, third, and fourth quarters of 2008, the Company
recorded LIFO provisions of $16.0 million, $15.7 million, and $12.1 million respectively. These
charges are reflected in Cost of goods sold for each quarter, respectively.
As discussed in Note 8, in the third quarter of 2008, based on the agreement in principle
to settle the Merger-related shareholder litigation, the Company recorded charges of
approximately $34.5 million in connection with the proposed settlement, which was net of
anticipated insurance proceeds of $7.5 million. In the fourth quarter of 2008, the Company
received insurance proceeds totaling $10.0 million, thus reducing the charges to $32.0 million