Dollar General 2008 Annual Report Download - page 118
Download and view the complete annual report
Please find page 118 of the 2008 Dollar General annual report below. You can navigate through the pages in the report by either clicking on the pages listed below, or by using the keyword search tool below to find specific information within the annual report.-
 1
1 -
2
-
3
-
4
-
5
-
6
-
7
-
8
-
9
-
10
-
11
-
12
-
13
-
14
-
15
-
16
-
17
-
18
-
19
-
20
-
21
-
22
-
23
-
24
-
25
-
26
-
27
-
28
-
29
-
30
-
31
-
32
-
33
-
34
-
35
-
36
-
37
-
38
-
39
-
40
-
41
-
42
-
43
-
44
-
45
-
46
-
47
-
48
-
49
-
50
-
51
-
52
-
53
-
54
-
55
-
56
-
57
-
58
-
59
-
60
-
61
-
62
-
63
-
64
-
65
-
66
-
67
-
68
-
69
-
70
-
71
-
72
-
73
-
74
-
75
-
76
-
77
-
78
-
79
-
80
-
81
-
82
-
83
-
84
-
85
-
86
-
87
-
88
-
89
-
90
-
91
-
92
-
93
-
94
-
95
-
96
-
97
-
98
-
99
-
100
-
101
-
102
-
103
-
104
-
105
-
106
-
107
-
 108
108 -
 109
109 -
 110
110 -
 111
111 -
 112
112 -
 113
113 -
 114
114 -
 115
115 -
 116
116 -
 117
117 -
 118
118 -
 119
119 -
 120
120 -
 121
121 -
 122
122 -
 123
123 -
 124
124 -
 125
125 -
 126
126 -
 127
127 -
 128
128 -
129
-
130
-
131
-
132
-
133
-
134
-
135
-
136
-
137
-
138
-
139
-
140
-
141
-
142
-
143
-
144
-
145
-
146
-
147
-
148
-
149
-
150
-
151
-
152
-
153
-
154
-
155
-
156
-
157
-
158
-
159
-
160
-
161
-
162
-
163
-
164
-
165
-
166
-
167
-
168
-
169
-
170
-
171
-
172
-
173
-
174
-
175
-
176
-
177
-
178
-
179
-
180
-
181
-
182
-
183
-
184
-
185
-
186
-
187
-
188
-
189
 |
 |

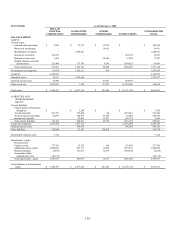
116
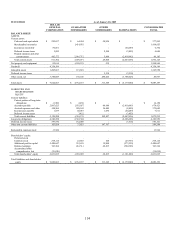
SUCCESSOR
For the year ended January 30, 2009
DOLLAR
GENERAL
CORPORATION
GUARANTOR
SUBSIDIARIES
OTHER
SUBSIDIARIES ELIMINATIONS
CONSOLIDATED
TOTAL
STATEMENTS OF
OPERATIONS:
Net sales $ 236,682 $ 10,457,668 $ 97,917 $ (334,599) $ 10,457,668
Cost of goods sold
-
7,396,571
-
-
7,396,571
Gross profit 236,682
3,061,097
97,917
(334,599) 3,061,097
Selling, general and administrative
210,665
2,499,331
73,214
(334,599)
2,448,611
Litigation settlement and related
costs, net 32,000 -
-
- 32,000
Operating profit (loss)
(5,983)
561,766
24,703
-
580,486
Interest income (62,722)
(36,844)
(13,532)
110,037 (3,061)
Interest expense
427,365
74,586
18
(110,037)
391,932
Other (income) expense (2,788)
-
-
- (2,788)
Income (loss) before income taxes (367,838)
524,024
38,217
- 194,403
Income taxes (115,924)
190,146
11,999
- 86,221
Equity in subsidiaries’ earnings,
net of taxes
360,096
-
-
(360,096)
-
Net income
$
108,182
$
333,878
$
26,218
$
(360,096)
$
108,182
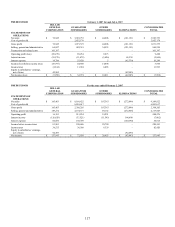
SUCCESSOR
March 6, 2007 through February 1, 2008
DOLLAR
GENERAL
CORPORATION
GUARANTOR
SUBSIDIARIES
OTHER
SUBSIDIARIES
ELIMINATIONS
CONSOLIDATED
TOTAL
STATEMENTS OF
OPERATIONS:
Net sales $ 96,300 $ 5,571,493 $ 65,057 $ (161,357) $ 5,571,493
Cost of goods sold
-
3,999,599
-
-
3,999,599
Gross profit 96,300
1,571,894
65,057
(161,357) 1,571,894
Selling, general and administrative 102,030
1,337,311
46,524
(161,357) 1,324,508
Transaction and related costs 1,242
-
-
- 1,242
Operating profit (loss)
(6,972)
234,583
18,533
-
246,144
Interest income (58,786)
(23,206)
(8,013)
86,206 (3,799)
Interest expense
274,104
64,991
8
(86,206)
252,897
Other (income) expense 3,639
-
-
- 3,639
Income (loss) before income taxes (225,929)
192,798
26,538
- (6,593)
Income taxes (76,881)
65,166
9,940
- (1,775)
Equity in subsidiaries’ earnings,
net of taxes
144,230
-
-
(144,230)
-
Net income (loss)
$
(4,818)
$
127,632
$
16,598
$
(144,230)
$
(4,818)