Dollar General 2008 Annual Report Download - page 72
Download and view the complete annual report
Please find page 72 of the 2008 Dollar General annual report below. You can navigate through the pages in the report by either clicking on the pages listed below, or by using the keyword search tool below to find specific information within the annual report.-
 1
1 -
2
-
3
-
4
-
5
-
6
-
7
-
8
-
9
-
10
-
11
-
12
-
13
-
14
-
15
-
16
-
17
-
18
-
19
-
20
-
21
-
22
-
23
-
24
-
25
-
26
-
27
-
28
-
29
-
30
-
31
-
32
-
33
-
34
-
35
-
36
-
37
-
38
-
39
-
40
-
41
-
42
-
43
-
44
-
45
-
46
-
47
-
48
-
49
-
50
-
51
-
52
-
53
-
54
-
55
-
56
-
57
-
58
-
59
-
60
-
61
-
 62
62 -
 63
63 -
 64
64 -
 65
65 -
 66
66 -
 67
67 -
 68
68 -
 69
69 -
 70
70 -
 71
71 -
 72
72 -
 73
73 -
 74
74 -
 75
75 -
 76
76 -
 77
77 -
 78
78 -
 79
79 -
 80
80 -
 81
81 -
 82
82 -
83
-
84
-
85
-
86
-
87
-
88
-
89
-
90
-
91
-
92
-
93
-
94
-
95
-
96
-
97
-
98
-
99
-
100
-
101
-
102
-
103
-
104
-
105
-
106
-
107
-
108
-
109
-
110
-
111
-
112
-
113
-
114
-
115
-
116
-
117
-
118
-
119
-
120
-
121
-
122
-
123
-
124
-
125
-
126
-
127
-
128
-
129
-
130
-
131
-
132
-
133
-
134
-
135
-
136
-
137
-
138
-
139
-
140
-
141
-
142
-
143
-
144
-
145
-
146
-
147
-
148
-
149
-
150
-
151
-
152
-
153
-
154
-
155
-
156
-
157
-
158
-
159
-
160
-
161
-
162
-
163
-
164
-
165
-
166
-
167
-
168
-
169
-
170
-
171
-
172
-
173
-
174
-
175
-
176
-
177
-
178
-
179
-
180
-
181
-
182
-
183
-
184
-
185
-
186
-
187
-
188
-
189
 |
 |

70
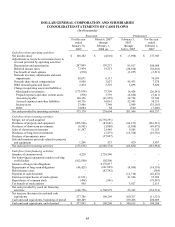
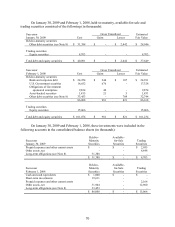
On January 30, 2009 and February 1, 2008, held-to-maturity, available-for-sale and
trading securities consisted of the following (in thousands):
Successor
January 30, 2009
Cost
Gross Unrealized
Estimated
Fair Value
Gains
Losses
Held-to-maturity securities
Other debt securities (see Note 8)
$
31,388
$
-
$
2,442
$
28,946
Trading securities
Equity securities
8,703
-
-
8,703
Total debt and equity securities
$
40,091
$
-
$
2,442
$
37,649
Successor
February 1, 2008
Cost
Gross Unrealized
Estimated
Fair Value
Gains
Losses
Held-to-maturity securities
Bank and corporate debt
$
24,254
$
244
$
107
$
24,391
U.S. Government securities
16,652
676
-
17,328
Obligations of Government
sponsored enterprises
9,834
40
-
9,874
Asset-backed securities
1,815
21
5
1,831
Other debt securities (see Note 8)
33,453
-
709
32,744
86,008
981
821
86,168
Trading securities
Equity securities
15,066
-
-
15,066
Total debt and equity securities
$
101,074
$
981
$
821
$
101,234
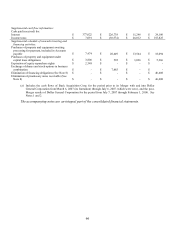
On January 30, 2009 and February 1, 2008, these investments were included in the
following accounts in the consolidated balance sheets (in thousands):
Successor
January 30, 2009
Held-to-
Maturity
Securities
Available-
for-Sale
Securities
Trading
Securities
Prepaid expenses and other current assets
$
-
$
-
$
2,055
Other assets, net
-
-
6,648
Long-term obligations (see Note 8)
31,388
-
-
$
31,388
$
-
$
8,703
Successor
February 1, 2008
Held-to-
Maturity
Securities
Available-
for-Sale
Securities
Trading
Securities
Cash and cash equivalents
$
1,000
$
-
$
-
Short-term investments
19,611
-
-
Prepaid expenses and other current assets
-
-
2,166
Other assets, net
31,944
-
12,900
Long-term obligations (see Note 8)
33,453
-
-
$
86,008
$
-
$
15,066