Dollar General 2008 Annual Report Download - page 31
Download and view the complete annual report
Please find page 31 of the 2008 Dollar General annual report below. You can navigate through the pages in the report by either clicking on the pages listed below, or by using the keyword search tool below to find specific information within the annual report.-
 1
1 -
2
-
3
-
4
-
5
-
6
-
7
-
8
-
9
-
10
-
11
-
12
-
13
-
14
-
15
-
16
-
17
-
18
-
19
-
20
-
 21
21 -
 22
22 -
 23
23 -
 24
24 -
 25
25 -
 26
26 -
 27
27 -
 28
28 -
 29
29 -
 30
30 -
 31
31 -
 32
32 -
 33
33 -
 34
34 -
 35
35 -
 36
36 -
 37
37 -
 38
38 -
 39
39 -
 40
40 -
 41
41 -
42
-
43
-
44
-
45
-
46
-
47
-
48
-
49
-
50
-
51
-
52
-
53
-
54
-
55
-
56
-
57
-
58
-
59
-
60
-
61
-
62
-
63
-
64
-
65
-
66
-
67
-
68
-
69
-
70
-
71
-
72
-
73
-
74
-
75
-
76
-
77
-
78
-
79
-
80
-
81
-
82
-
83
-
84
-
85
-
86
-
87
-
88
-
89
-
90
-
91
-
92
-
93
-
94
-
95
-
96
-
97
-
98
-
99
-
100
-
101
-
102
-
103
-
104
-
105
-
106
-
107
-
108
-
109
-
110
-
111
-
112
-
113
-
114
-
115
-
116
-
117
-
118
-
119
-
120
-
121
-
122
-
123
-
124
-
125
-
126
-
127
-
128
-
129
-
130
-
131
-
132
-
133
-
134
-
135
-
136
-
137
-
138
-
139
-
140
-
141
-
142
-
143
-
144
-
145
-
146
-
147
-
148
-
149
-
150
-
151
-
152
-
153
-
154
-
155
-
156
-
157
-
158
-
159
-
160
-
161
-
162
-
163
-
164
-
165
-
166
-
167
-
168
-
169
-
170
-
171
-
172
-
173
-
174
-
175
-
176
-
177
-
178
-
179
-
180
-
181
-
182
-
183
-
184
-
185
-
186
-
187
-
188
-
189
 |
 |

29
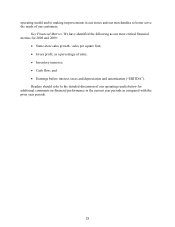
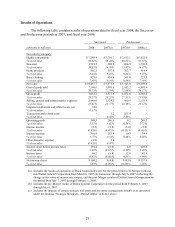
Results of Operations
The following table contains results of operations data for fiscal year 2008, the Successor
and Predecessor periods in 2007, and fiscal year 2006.
(amounts in millions)
Successor
Predecessor
2008
2007(a)
2007(b)
2006(c)
Net sales by category:
Highly consumable
$ 7,248.4
$ 3,701.7
$ 2,615.1
$ 6,022.0
% of net sales
69.31%
66.44%
66.65%
65.67%
Seasonal
1,521.5
908.3
604.9
1,510.0
% of net sales
14.55%
16.30%
15.42%
16.47%
Home products
862.2
507.0
362.7
914.4
% of net sales
8.24%
9.10%
9.24%
9.97%
Basic clothing
825.6
454.4
341.0
723.5
% of net sales
7.89%
8.16%
8.69%
7.89%
Net sales
$ 10,457.7
$ 5,571.5
$ 3,923.8
$ 9,169.8
Cost of goods sold
7,396.6
3,999.6
2,852.2
6,801.6
% of net sales
70.73%
71.79%
72.69%
74.17%
Gross profit
3,061.1
1,571.9
1,071.6
2,368.2
% of net sales
29.27%
28.21%
27.31%
25.83%
Selling, general and administrative expenses
2,448.6
1,324.5
960.9
2,119.9
% of net sales
23.41%
23.77%
24.49%
23.12%
Litigation settlement and related costs, net
32.0
-
-
-
% of net sales
0.31%
-
-
-
Transaction and related costs
-
1.2
101.4
-
% of net sales
-
0.02%
2.58%
-
Operating profit
580.5
246.1
9.2
248.3
% of net sales
5.55%
4.42%
0.24%
2.71%
Interest income
(3.1)
(3.8)
(5.0)
(7.0)
% of net sales
(0.03)%
(0.07)%
(0.13)%
(0.08)%
Interest expense
391.9
252.9
10.3
34.9
% of net sales
3.75%
4.54%
0.26%
0.38%
Other (income) expense
(2.8)
3.6
-
-
% of net sales
(0.03)%
0.07%
-
-
Income (loss) before income taxes
194.4
(6.6)
4.0
220.4
% of net sales
1.86%
(0.12)%
0.10%
2.40%
Income taxes
86.2
(1.8)
12.0
82.4
% of net sales
0.82%
(0.03)%
0.31%
0.90%
Net income (loss)
$ 108.2
$ (4.8)
$ (8.0)
$ 137.9
% of net sales
1.03%
(0.09)%
(0.20)%
1.50%
(a) Includes the results of operations of Buck Acquisition Corp. for the period prior to its Merger with and
into Dollar General Corporation from March 6, 2007 (its formation) through July 6, 2007 (reflecting the
change in fair value of interest rate swaps), and the post-Merger results of Dollar General Corporation for
the period from July 7, 2007 through February 1, 2008.
(b) Includes the pre-Merger results of Dollar General Corporation for the period from February 3, 2007
through July 6, 2007.
(c) Includes the impacts of certain strategic real estate and inventory management initiatives as described
under the heading “Strategic Initiatives—Project Alpha” in Item 1 above.