Dollar General 2008 Annual Report Download - page 86
Download and view the complete annual report
Please find page 86 of the 2008 Dollar General annual report below. You can navigate through the pages in the report by either clicking on the pages listed below, or by using the keyword search tool below to find specific information within the annual report.-
 1
1 -
2
-
3
-
4
-
5
-
6
-
7
-
8
-
9
-
10
-
11
-
12
-
13
-
14
-
15
-
16
-
17
-
18
-
19
-
20
-
21
-
22
-
23
-
24
-
25
-
26
-
27
-
28
-
29
-
30
-
31
-
32
-
33
-
34
-
35
-
36
-
37
-
38
-
39
-
40
-
41
-
42
-
43
-
44
-
45
-
46
-
47
-
48
-
49
-
50
-
51
-
52
-
53
-
54
-
55
-
56
-
57
-
58
-
59
-
60
-
61
-
62
-
63
-
64
-
65
-
66
-
67
-
68
-
69
-
70
-
71
-
72
-
73
-
74
-
75
-
 76
76 -
 77
77 -
 78
78 -
 79
79 -
 80
80 -
 81
81 -
 82
82 -
 83
83 -
 84
84 -
 85
85 -
 86
86 -
 87
87 -
 88
88 -
 89
89 -
 90
90 -
 91
91 -
 92
92 -
 93
93 -
 94
94 -
 95
95 -
 96
96 -
97
-
98
-
99
-
100
-
101
-
102
-
103
-
104
-
105
-
106
-
107
-
108
-
109
-
110
-
111
-
112
-
113
-
114
-
115
-
116
-
117
-
118
-
119
-
120
-
121
-
122
-
123
-
124
-
125
-
126
-
127
-
128
-
129
-
130
-
131
-
132
-
133
-
134
-
135
-
136
-
137
-
138
-
139
-
140
-
141
-
142
-
143
-
144
-
145
-
146
-
147
-
148
-
149
-
150
-
151
-
152
-
153
-
154
-
155
-
156
-
157
-
158
-
159
-
160
-
161
-
162
-
163
-
164
-
165
-
166
-
167
-
168
-
169
-
170
-
171
-
172
-
173
-
174
-
175
-
176
-
177
-
178
-
179
-
180
-
181
-
182
-
183
-
184
-
185
-
186
-
187
-
188
-
189
 |
 |

84
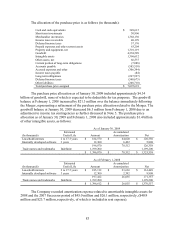
For intangible assets subject to amortization, the estimated aggregate amortization
expense for each of the five succeeding fiscal years is as follows: 2009 - $41.1 million, 2010 -
$27.3 million, 2011 - $20.9 million, 2012 - $17.0 million, and 2013 - $12.0 million.
Fees and expenses related to the Merger totaled $102.6 million, principally consisting of
investment banking fees, legal fees and stock compensation ($39.4 million as further discussed
in Note 10), and are reflected in the 2007 results of operations. Capitalized debt issuance costs
as of the Merger date of $87.4 million for Merger-related financing were reflected in other long-
term assets in the consolidated balance sheet.
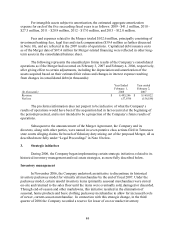
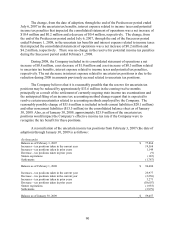
The following represents the unaudited pro forma results of the Company’ s consolidated
operations as if the Merger had occurred on February 3, 2007 and February 4, 2006, respectively,
after giving effect to certain adjustments, including the depreciation and amortization of the
assets acquired based on their estimated fair values and changes in interest expense resulting
from changes in consolidated debt (in thousands):
(In thousands)
Year Ended
February 1,
2008
Year ended
February 2,
2007
Revenue
$
9,495,246
$
9,169,822
Net loss
(57,939)
(156,188)
The pro forma information does not purport to be indicative of what the Company’ s
results of operations would have been if the acquisition had in fact occurred at the beginning of
the periods presented, and is not intended to be a projection of the Company’ s future results of
operations.
Subsequent to the announcement of the Merger Agreement, the Company and its
directors, along with other parties, were named in seven putative class actions filed in Tennessee
state courts alleging claims for breach of fiduciary duty arising out of the proposed Merger, all as
described more fully under “Legal Proceedings” in Note 8 below.
3. Strategic initiatives
During 2006, the Company began implementing certain strategic initiatives related to its
historical inventory management and real estate strategies, as more fully described below.
Inventory management
In November 2006, the Company undertook an initiative to discontinue its historical
inventory packaway model for virtually all merchandise by the end of fiscal 2007. Under the
packaway model, certain unsold inventory items (primarily seasonal merchandise) were stored
on-site and returned to the sales floor until the items were eventually sold, damaged or discarded.
Through end-of-season and other markdowns, this initiative resulted in the elimination of
seasonal, home products and basic clothing packaway merchandise to allow for increased levels
of newer, current-season merchandise. In connection with this strategic change, in the third
quarter of 2006 the Company recorded a reserve for lower of cost or market inventory