Dollar General 2008 Annual Report Download - page 28
Download and view the complete annual report
Please find page 28 of the 2008 Dollar General annual report below. You can navigate through the pages in the report by either clicking on the pages listed below, or by using the keyword search tool below to find specific information within the annual report.-
 1
1 -
2
-
3
-
4
-
5
-
6
-
7
-
8
-
9
-
10
-
11
-
12
-
13
-
14
-
15
-
16
-
17
-
 18
18 -
 19
19 -
 20
20 -
 21
21 -
 22
22 -
 23
23 -
 24
24 -
 25
25 -
 26
26 -
 27
27 -
 28
28 -
 29
29 -
 30
30 -
 31
31 -
 32
32 -
 33
33 -
 34
34 -
 35
35 -
 36
36 -
 37
37 -
 38
38 -
39
-
40
-
41
-
42
-
43
-
44
-
45
-
46
-
47
-
48
-
49
-
50
-
51
-
52
-
53
-
54
-
55
-
56
-
57
-
58
-
59
-
60
-
61
-
62
-
63
-
64
-
65
-
66
-
67
-
68
-
69
-
70
-
71
-
72
-
73
-
74
-
75
-
76
-
77
-
78
-
79
-
80
-
81
-
82
-
83
-
84
-
85
-
86
-
87
-
88
-
89
-
90
-
91
-
92
-
93
-
94
-
95
-
96
-
97
-
98
-
99
-
100
-
101
-
102
-
103
-
104
-
105
-
106
-
107
-
108
-
109
-
110
-
111
-
112
-
113
-
114
-
115
-
116
-
117
-
118
-
119
-
120
-
121
-
122
-
123
-
124
-
125
-
126
-
127
-
128
-
129
-
130
-
131
-
132
-
133
-
134
-
135
-
136
-
137
-
138
-
139
-
140
-
141
-
142
-
143
-
144
-
145
-
146
-
147
-
148
-
149
-
150
-
151
-
152
-
153
-
154
-
155
-
156
-
157
-
158
-
159
-
160
-
161
-
162
-
163
-
164
-
165
-
166
-
167
-
168
-
169
-
170
-
171
-
172
-
173
-
174
-
175
-
176
-
177
-
178
-
179
-
180
-
181
-
182
-
183
-
184
-
185
-
186
-
187
-
188
-
189
 |
 |
26
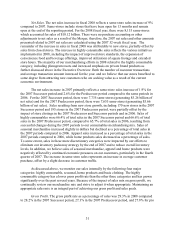
• We generated $575.2 million of cash from operating activities, a portion of which we
used to invest in our stores and to reduce long-term obligations. At year end, our cash
balance of $378 million included $310 million invested in money market funds.
Because of uncertainties in the current financial markets, we believe maintaining
excess liquidity is prudent.
• During 2008, we opened 207 new stores, remodeled or relocated 404 stores, and
closed 39 stores, resulting in a store count of 8,362 on January 30, 2009. In addition,
we are pleased with the progress we made during the year in our efforts to better
utilize existing square footage and to improve the appearance of our stores.
Discussion of Operating Priorities. Our first priority is driving productive sales growth
by increasing shopper frequency and transaction amount and maximizing sales per square foot.
We utilized numerous initiatives in 2008 to enable productive sales growth. For example, we are
defining and improving our store standards with a goal of developing a consistent look and feel
across all stores. We expanded convenience foods and beverages, added new impulse racks at the
checkout stands, and expanded our store operating hours. To further increase space utilization,
we have begun the process of raising the height of merchandise fixtures in our stores, starting
with the food area.
Our second priority is to increase gross profit through shrink reduction, distribution
efficiencies, an improved pricing model, the expansion of private brand offerings and increased
foreign sourcing. In 2008, inventory shrink decreased as a result of several focused initiatives,
including the elimination of packaway inventories from the stockrooms, the installation of
additional security cameras, the implementation of exception-based shrink detection tools, and
improved hiring practices and employee retention. In 2008, higher sales volumes contributed to
our ability to leverage transportation and distribution costs, and we were able to offset the impact
of higher average fuel costs for the year through better trailer utilization, expansion of backhaul
opportunities and improved fleet management. We reviewed and reset our consumables
planograms, eliminating less productive items in order to add more productive ones. In this
process, we reviewed our pricing strategy and worked diligently to minimize vendor cost
increases. Some merchandise cost increases were unavoidable in 2008, but as a result of our
improved pricing analysis tools, we were able to recoup a portion of these increases through
pricing. We continue to focus on sales of private brand consumables, which generally have
higher gross profit rates, while continuing to offer a wide variety of national brands in our efforts
to offer the optimal mix of products to our customers. With regard to the expansion of foreign
sourcing, we are still in the early stages of defining the objectives and building the team.
Our third priority is leveraging process improvements and information technology to
reduce costs. We are committed as an organization to extract costs that do not affect the
customer experience. Examples of cost reduction initiatives in 2008 include recycling of
cardboard, reduction of workers compensation expense through a focus on safety, and
improvement of energy management in the stores through installation and monitoring of new
equipment. With regard to information technology, we are focusing our resources on improving
systems that are designed to enhance retail store operations and merchandising.