Dollar General 2008 Annual Report Download - page 73
Download and view the complete annual report
Please find page 73 of the 2008 Dollar General annual report below. You can navigate through the pages in the report by either clicking on the pages listed below, or by using the keyword search tool below to find specific information within the annual report.-
 1
1 -
2
-
3
-
4
-
5
-
6
-
7
-
8
-
9
-
10
-
11
-
12
-
13
-
14
-
15
-
16
-
17
-
18
-
19
-
20
-
21
-
22
-
23
-
24
-
25
-
26
-
27
-
28
-
29
-
30
-
31
-
32
-
33
-
34
-
35
-
36
-
37
-
38
-
39
-
40
-
41
-
42
-
43
-
44
-
45
-
46
-
47
-
48
-
49
-
50
-
51
-
52
-
53
-
54
-
55
-
56
-
57
-
58
-
59
-
60
-
61
-
62
-
 63
63 -
 64
64 -
 65
65 -
 66
66 -
 67
67 -
 68
68 -
 69
69 -
 70
70 -
 71
71 -
 72
72 -
 73
73 -
 74
74 -
 75
75 -
 76
76 -
 77
77 -
 78
78 -
 79
79 -
 80
80 -
 81
81 -
 82
82 -
 83
83 -
84
-
85
-
86
-
87
-
88
-
89
-
90
-
91
-
92
-
93
-
94
-
95
-
96
-
97
-
98
-
99
-
100
-
101
-
102
-
103
-
104
-
105
-
106
-
107
-
108
-
109
-
110
-
111
-
112
-
113
-
114
-
115
-
116
-
117
-
118
-
119
-
120
-
121
-
122
-
123
-
124
-
125
-
126
-
127
-
128
-
129
-
130
-
131
-
132
-
133
-
134
-
135
-
136
-
137
-
138
-
139
-
140
-
141
-
142
-
143
-
144
-
145
-
146
-
147
-
148
-
149
-
150
-
151
-
152
-
153
-
154
-
155
-
156
-
157
-
158
-
159
-
160
-
161
-
162
-
163
-
164
-
165
-
166
-
167
-
168
-
169
-
170
-
171
-
172
-
173
-
174
-
175
-
176
-
177
-
178
-
179
-
180
-
181
-
182
-
183
-
184
-
185
-
186
-
187
-
188
-
189
 |
 |
71
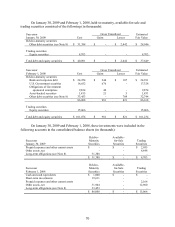
The contractual maturities of held-to-maturity securities as of January 30, 2009 were in
excess of three years and were $31.4 million at cost and $28.9 million at fair value, respectively.
For the Successor year ended January 30, 2009 and period ended February 1, 2008, and
the Predecessor period ended July 6, 2007 and year ended February 2, 2007, gross realized gains
and losses on the sales of available-for-sale securities were not material. The cost of securities
sold is based upon the specific identification method.
Merchandise inventories
Inventories are stated at the lower of cost or market with cost determined using the retail
last-in, first-out (“LIFO”) method. Under the Company’ s retail inventory method (“RIM”), the
calculation of gross profit and the resulting valuation of inventories at cost are computed by
applying a calculated cost-to-retail inventory ratio to the retail value of sales at a department
level. Costs directly associated with warehousing and distribution are capitalized into inventory.
The excess of current cost over LIFO cost was approximately $50.0 million at January 30, 2009
and $6.1 million at February 1, 2008. Current cost is determined using the retail first-in, first-out
method. The Company’ s LIFO reserves were adjusted to zero at July 6, 2007 as a result of the
Merger. The Successor recorded LIFO provisions of $43.9 million and $6.1 million during 2008
and 2007, respectively. The Predecessor recorded a LIFO credit of $1.5 million in 2006.
In 2008, the increased commodity cost pressures mainly related to food and pet products
which have been driven by fruit and vegetable prices and rising freight costs. Increases in
petroleum, resin, metals, pulp and other raw material commodity driven costs also resulted in
multiple product cost increases. The Company intends to address these commodity cost increases
through negotiations with its vendors and by increasing retail prices as necessary. On a quarterly
basis, the Company estimates the annual impact of commodity cost fluctuations based upon the
best available information at that point in time.
Store pre-opening costs
Pre-opening costs related to new store openings and the construction periods are
expensed as incurred.
Property and equipment
Property and equipment are recorded at cost. The Company provides for depreciation
and amortization on a straight-line basis over the following estimated useful lives:
Land improvements
20
Buildings
39-40
Furniture, fixtures and equipment
3-10
Improvements of leased properties are amortized over the shorter of the life of the
applicable lease term or the estimated useful life of the asset.