Dollar General 2008 Annual Report Download - page 39
Download and view the complete annual report
Please find page 39 of the 2008 Dollar General annual report below. You can navigate through the pages in the report by either clicking on the pages listed below, or by using the keyword search tool below to find specific information within the annual report.-
 1
1 -
2
-
3
-
4
-
5
-
6
-
7
-
8
-
9
-
10
-
11
-
12
-
13
-
14
-
15
-
16
-
17
-
18
-
19
-
20
-
21
-
22
-
23
-
24
-
25
-
26
-
27
-
28
-
 29
29 -
 30
30 -
 31
31 -
 32
32 -
 33
33 -
 34
34 -
 35
35 -
 36
36 -
 37
37 -
 38
38 -
 39
39 -
 40
40 -
 41
41 -
 42
42 -
 43
43 -
 44
44 -
 45
45 -
 46
46 -
 47
47 -
 48
48 -
 49
49 -
50
-
51
-
52
-
53
-
54
-
55
-
56
-
57
-
58
-
59
-
60
-
61
-
62
-
63
-
64
-
65
-
66
-
67
-
68
-
69
-
70
-
71
-
72
-
73
-
74
-
75
-
76
-
77
-
78
-
79
-
80
-
81
-
82
-
83
-
84
-
85
-
86
-
87
-
88
-
89
-
90
-
91
-
92
-
93
-
94
-
95
-
96
-
97
-
98
-
99
-
100
-
101
-
102
-
103
-
104
-
105
-
106
-
107
-
108
-
109
-
110
-
111
-
112
-
113
-
114
-
115
-
116
-
117
-
118
-
119
-
120
-
121
-
122
-
123
-
124
-
125
-
126
-
127
-
128
-
129
-
130
-
131
-
132
-
133
-
134
-
135
-
136
-
137
-
138
-
139
-
140
-
141
-
142
-
143
-
144
-
145
-
146
-
147
-
148
-
149
-
150
-
151
-
152
-
153
-
154
-
155
-
156
-
157
-
158
-
159
-
160
-
161
-
162
-
163
-
164
-
165
-
166
-
167
-
168
-
169
-
170
-
171
-
172
-
173
-
174
-
175
-
176
-
177
-
178
-
179
-
180
-
181
-
182
-
183
-
184
-
185
-
186
-
187
-
188
-
189
 |
 |

37
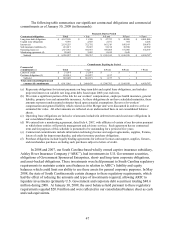
Notes to Unaudited Pro Forma Condensed Consolidated Statement of Operations
(a) Represents the estimated impact on cost of goods sold of the adjustment to fair value of the
property and equipment at our distribution centers.
(b) Primarily represents depreciation and amortization of the fair value adjustments related to
tangible and intangible long-lived assets. Identifiable intangible assets with a determinable life
have been amortized on a straight-line basis in the unaudited pro forma consolidated statement of
operations over a period ranging from 2 to 17.5 years. The primary fair value adjustments (on
which the pro forma adjustments are based) impacting SG&A expenses were to leasehold
interests ($185 million), property and equipment ($101 million) and internally developed
software ($12 million). This adjustment also includes management fees that are payable to
affiliates of certain of the Investors subsequent to the closing of the Merger and related
transactions (at an initial annual rate of $5.0 million which shall be increased by 5% for each
succeeding year during the term of the agreement).
(c) Represents $101.4 million of charges that are non-recurring in nature and directly attributable
to the Merger and related transactions. Such charges are comprised of $39.4 million of stock
compensation expense from the acceleration of unvested stock options, restricted stock and
restricted stock units as required as a result of the Merger and $62.0 million of transaction costs
we incurred that were expensed as one-time charges upon the close of the Merger. Such
adjustments do not include any adjustments to reflect the effects of our new stock based
compensation plan.
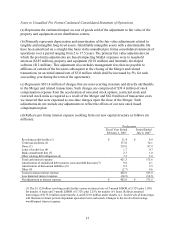
(d) Reflects pro forma interest expense resulting from our new capital structure as follows (in
millions):
Predecessor
Fiscal Year Ended
February 2, 2007
Period Ended
July 6, 2007
Revolving credit facility (1)
$
21.4
$
8.9
Term loan facilities (2)
177.8
74.1
Notes (3)
210.9
87.9
Letter of credit fees (4)
1.7
0.7
Bank commitment fees (5)
2.3
1.0
Other existing debt obligations (6)
7.2
3.0
Total cash interest expense
421.3
175.6
Amortization of capitalized debt issuance costs and debt discount (7)
9.8
4.1
Amortization of discounted liabilities (8)
8.5
3.5
Other (9)
(2.7)
0.6
Total pro forma interest expense
436.9
183.8
Less historical interest expense
(34.9)
(10.3)
Net adjustment to interest expense
$
402.0
$
173.5
(1) The $1.125 billion revolving credit facility carries an interest rate of 3-month LIBOR of 5.32% plus 1.50%
for tranche A loans and 3-month LIBOR of 5.32% plus 2.25% for tranche A-1 loans. Reflects assumed
borrowings of $175.0 million under tranche A and $125.0 million under tranche A-1. Such levels of borrowings
will fluctuate in future periods dependent upon short term cash needs. Changes in the levels of borrowings
would impact interest expense.