Dollar General 2008 Annual Report Download - page 33
Download and view the complete annual report
Please find page 33 of the 2008 Dollar General annual report below. You can navigate through the pages in the report by either clicking on the pages listed below, or by using the keyword search tool below to find specific information within the annual report.-
 1
1 -
2
-
3
-
4
-
5
-
6
-
7
-
8
-
9
-
10
-
11
-
12
-
13
-
14
-
15
-
16
-
17
-
18
-
19
-
20
-
21
-
22
-
 23
23 -
 24
24 -
 25
25 -
 26
26 -
 27
27 -
 28
28 -
 29
29 -
 30
30 -
 31
31 -
 32
32 -
 33
33 -
 34
34 -
 35
35 -
 36
36 -
 37
37 -
 38
38 -
 39
39 -
 40
40 -
 41
41 -
 42
42 -
 43
43 -
44
-
45
-
46
-
47
-
48
-
49
-
50
-
51
-
52
-
53
-
54
-
55
-
56
-
57
-
58
-
59
-
60
-
61
-
62
-
63
-
64
-
65
-
66
-
67
-
68
-
69
-
70
-
71
-
72
-
73
-
74
-
75
-
76
-
77
-
78
-
79
-
80
-
81
-
82
-
83
-
84
-
85
-
86
-
87
-
88
-
89
-
90
-
91
-
92
-
93
-
94
-
95
-
96
-
97
-
98
-
99
-
100
-
101
-
102
-
103
-
104
-
105
-
106
-
107
-
108
-
109
-
110
-
111
-
112
-
113
-
114
-
115
-
116
-
117
-
118
-
119
-
120
-
121
-
122
-
123
-
124
-
125
-
126
-
127
-
128
-
129
-
130
-
131
-
132
-
133
-
134
-
135
-
136
-
137
-
138
-
139
-
140
-
141
-
142
-
143
-
144
-
145
-
146
-
147
-
148
-
149
-
150
-
151
-
152
-
153
-
154
-
155
-
156
-
157
-
158
-
159
-
160
-
161
-
162
-
163
-
164
-
165
-
166
-
167
-
168
-
169
-
170
-
171
-
172
-
173
-
174
-
175
-
176
-
177
-
178
-
179
-
180
-
181
-
182
-
183
-
184
-
185
-
186
-
187
-
188
-
189
 |
 |
31
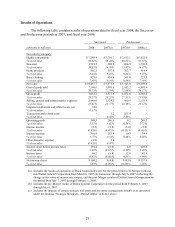
Net Sales. The net sales increase in fiscal 2008 reflects a same-store sales increase of 9%
compared to 2007. Same-stores include stores that have been open for 13 months and remain
open at the end of the reporting period. For the 2008 fiscal year, there were 8,153 same-stores
which accounted for sales of $10.12 billion. There were no purchase accounting or other
adjustments to net sales as a result of the Merger, therefore, the 2007 net sales and other amounts
presented related to 2007 net sales are calculated using the 2007 52-week fiscal year. The
remainder of the increase in sales in fiscal 2008 was attributable to new stores, partially offset by
sales from closed stores. The increase in highly consumable sales reflects the various initiatives
implemented in 2008, including the impact of improved store standards, the expansion of
convenience food and beverage offerings, improved utilization of square footage and extended
store hours. The majority of our merchandising efforts in 2008 related to the highly consumable
category, including planogram resets and increased emphasis on private brand products as
further discussed above in the Executive Overview. Both the number of customer transactions
and average transaction amount increased for the year. and we believe that our stores benefited to
some degree from attracting new customers who are seeking value as a result of the current
economic environment.
The net sales increase in 2007 primarily reflects a same-store sales increase of 1.9% for
the 2007 Successor period and 2.6% for the Predecessor period compared to the same periods in
2006. For the 2007 Successor period, there were 7,735 same-stores (generating $5.26 billion of
net sales) and for the 2007 Predecessor period, there were 7,655 same-stores (generating $3.66
billion of net sales). Sales resulting from new store growth, including 170 new stores in the 2007
Successor period and 195 stores in the 2007 Predecessor period, were partially offset by the
impact of store closings in the 2007 Predecessor and Successor periods and in 2006. Sales of
highly consumables were 66.4% of total sales in the 2007 Successor period and 66.6% of total
sales in the 2007 Predecessor period, compared to 65.7% of total sales in 2006, resulting from
successful changes during the 2007 periods to our consumables merchandising mix. Sales of
seasonal merchandise increased slightly in dollars but declined as a percentage of total sales in
the 2007 periods compared to 2006. Apparel sales increased as a percentage of total sales in the
2007 periods compared to 2006, while home products sales decreased as a percentage of sales.
To some extent, sales in these more discretionary categories were impacted by our efforts to
eliminate our inventory packaway strategy by the end of 2007 and to reduce overall inventory
levels. In addition, we believe sales of seasonal merchandise, apparel and home products were
negatively affected by continued economic pressures on our customers, particularly in the fourth
quarter of 2007. The increase in same-store sales represents an increase in average customer
purchase, offset by a slight decrease in customer traffic.
As discussed above, we monitor our sales internally by the following four major
categories: highly consumable, seasonal, home products and basic clothing. The highly
consumable category has a lower gross profit rate than the other three categories and has grown
significantly over the past several years. Because of the impact of sales mix on gross profit, we
continually review our merchandise mix and strive to adjust it when appropriate. Maintaining an
appropriate sales mix is an integral part of achieving our gross profit and sales goals.
Gross Profit. The gross profit rate as a percentage of sales was 29.3% in 2008 compared
to 28.2% in the 2007 Successor period, 27.3% in the 2007 Predecessor period, and 27.8% for pro