Blackberry 2015 Annual Report Download - page 94
Download and view the complete annual report
Please find page 94 of the 2015 Blackberry annual report below. You can navigate through the pages in the report by either clicking on the pages listed below, or by using the keyword search tool below to find specific information within the annual report.-
 1
1 -
2
-
3
-
4
-
5
-
6
-
7
-
8
-
9
-
10
-
11
-
12
-
13
-
14
-
15
-
16
-
17
-
18
-
19
-
20
-
21
-
22
-
23
-
24
-
25
-
26
-
27
-
28
-
29
-
30
-
31
-
32
-
33
-
34
-
35
-
36
-
37
-
38
-
39
-
40
-
41
-
42
-
43
-
44
-
45
-
46
-
47
-
48
-
49
-
50
-
51
-
52
-
53
-
54
-
55
-
56
-
57
-
58
-
59
-
60
-
61
-
62
-
63
-
64
-
65
-
66
-
67
-
68
-
69
-
70
-
71
-
72
-
73
-
74
-
75
-
76
-
77
-
78
-
79
-
80
-
81
-
82
-
83
-
 84
84 -
 85
85 -
 86
86 -
 87
87 -
 88
88 -
 89
89 -
 90
90 -
 91
91 -
 92
92 -
 93
93 -
 94
94 -
 95
95 -
 96
96 -
 97
97 -
 98
98 -
 99
99 -
 100
100 -
 101
101 -
 102
102 -
 103
103 -
 104
104 -
105
-
106
-
107
-
108
-
109
-
110
-
111
-
112
-
113
-
114
-
115
-
116
-
117
-
118
-
119
-
120
-
121
-
122
-
123
-
124
-
125
-
126
-
127
-
128
-
129
-
130
-
131
-
132
-
133
-
134
-
135
-
136
-
137
-
138
-
139
-
140
-
141
-
142
-
143
-
144
-
145
-
146
-
147
-
148
-
149
-
150
-
151
-
152
-
153
-
154
-
155
-
156
-
157
-
158
-
159
-
160
-
161
-
162
-
163
-
164
-
165
-
166
-
167
-
168
-
169
-
170
-
171
-
172
-
173
-
174
-
175
-
176
-
177
-
178
-
179
-
180
-
181
-
182
-
183
-
184
-
185
-
186
-
187
-
188
-
189
-
190
-
191
-
192
-
193
-
194
-
195
-
196
-
197
-
198
-
199
-
200
-
201
-
202
-
203
-
204
-
205
-
206
-
207
-
208
-
209
-
210
-
211
-
212
-
213
-
214
-
215
-
216
-
217
-
218
 |
 |

BlackBerry Limited
Notes to the Consolidated Financial Statements
In millions of United States dollars, except share and per share data, and except as otherwise indicated
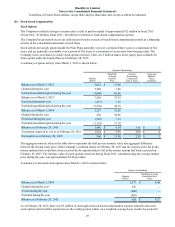
19
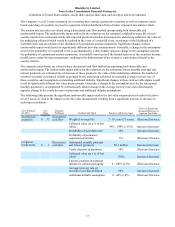
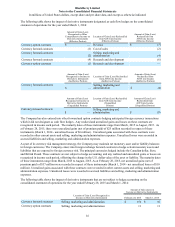
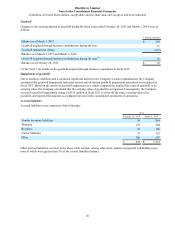
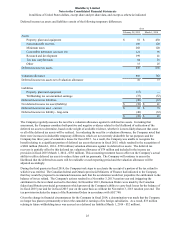
Intangible assets, net
Intangible assets were comprised of the following:
As at February 28, 2015
Cost Accumulated
Amortization Net Book
Value
Acquired technology $ 473 $ 329 $ 144
Intellectual property 2,545 1,314 1,231
$ 3,018 $ 1,643 $ 1,375
As at March 1, 2014
Cost Accumulated
Amortization Net Book
Value
Acquired technology $ 410 $ 292 $ 118
Intellectual property 2,176 855 1,321
$ 2,586 $ 1,147 $ 1,439
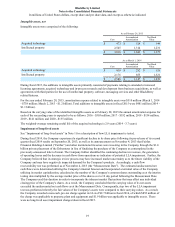
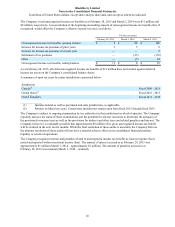
During fiscal 2015, the additions to intangible assets primarily consisted of payments relating to amended or renewed
licensing agreements, acquired technology and in-process research and development from business acquisitions, as well as
agreements with third parties for the use of intellectual property, software, messaging services and other BlackBerry
related features.
For the year ended February 28, 2015, amortization expense related to intangible assets was $510 million (March 1, 2014
- $738 million; March 2, 2013 - $1.2 billion). Total additions to intangible assets in fiscal 2015 were $481 million (2014 -
$1.1 billion).
Based on the carrying value of the identified intangible assets as at February 28, 2015 the annual amortization expense for
each of the succeeding years is expected to be as follows: 2016 - $303 million; 2017 - $192 million; 2018 - $154 million;
2019 - $141 million; and 2020 - $135 million.
The weighted-average remaining useful life of the acquired technology is 2.9 years (2014 - 3.7 years).
Impairment of long-lived assets
See “Impairment of long-lived assets” in Note 1 for a description of how LLA impairment is tested.
During fiscal 2014, the Company experienced a significant decline in its share price following its pre-release of its second
quarter fiscal 2014 results on September 20, 2013, as well as its announcement on November 4, 2013 that Fairfax
Financial Holdings Limited (“Fairfax”) and other institutional investors were investing in the Company through the $1.0
billion private placement of the Debentures in lieu of finalizing the purchase of the Company as contemplated in the
previously-announced letter of intent. The Company further identified the continuing decline in revenues, the generation
of operating losses and the decrease in cash flows from operations as indicators of potential LLA impairment. Further, the
Company believed that its strategic review process may have increased market uncertainty as to the future viability of the
Company and may have negatively impacted demand for the Company's products. Accordingly, a cash flow
recoverability test was performed as of November 4, 2013 (the “Measurement Date”). The estimated undiscounted net
cash flows were determined utilizing the Company's internal forecast and incorporated a terminal value of the Company
utilizing its market capitalization, calculated as the number of the Company's common shares outstanding as at the interim
testing date multiplied by the average market price of the shares over a 10 day period following the Measurement Date.
The Company used this duration in order to incorporate the inherent market fluctuations that may affect any individual
closing price of the Company's shares. As a result, the Company concluded that the carrying value of its net assets
exceeded the undiscounted net cash flows as at the Measurement Date. Consequently, step two of the LLA impairment
test was performed whereby the fair values of the Company's assets were compared to their carrying values. As a result,
the Company recorded a non-cash, pre-tax charge against its LLA of $2.7 billion in fiscal 2014, of which $852 million of
the charge was applicable to property, plant and equipment and $1.9 billion was applicable to intangible assets. There
were no long-lived asset impairment charges taken in fiscal 2015.