Blackberry 2015 Annual Report Download - page 139
Download and view the complete annual report
Please find page 139 of the 2015 Blackberry annual report below. You can navigate through the pages in the report by either clicking on the pages listed below, or by using the keyword search tool below to find specific information within the annual report.-
 1
1 -
2
-
3
-
4
-
5
-
6
-
7
-
8
-
9
-
10
-
11
-
12
-
13
-
14
-
15
-
16
-
17
-
18
-
19
-
20
-
21
-
22
-
23
-
24
-
25
-
26
-
27
-
28
-
29
-
30
-
31
-
32
-
33
-
34
-
35
-
36
-
37
-
38
-
39
-
40
-
41
-
42
-
43
-
44
-
45
-
46
-
47
-
48
-
49
-
50
-
51
-
52
-
53
-
54
-
55
-
56
-
57
-
58
-
59
-
60
-
61
-
62
-
63
-
64
-
65
-
66
-
67
-
68
-
69
-
70
-
71
-
72
-
73
-
74
-
75
-
76
-
77
-
78
-
79
-
80
-
81
-
82
-
83
-
84
-
85
-
86
-
87
-
88
-
89
-
90
-
91
-
92
-
93
-
94
-
95
-
96
-
97
-
98
-
99
-
100
-
101
-
102
-
103
-
104
-
105
-
106
-
107
-
108
-
109
-
110
-
111
-
112
-
113
-
114
-
115
-
116
-
117
-
118
-
119
-
120
-
121
-
122
-
123
-
124
-
125
-
126
-
127
-
128
-
 129
129 -
 130
130 -
 131
131 -
 132
132 -
 133
133 -
 134
134 -
 135
135 -
 136
136 -
 137
137 -
 138
138 -
 139
139 -
 140
140 -
 141
141 -
 142
142 -
 143
143 -
 144
144 -
 145
145 -
 146
146 -
 147
147 -
 148
148 -
 149
149 -
150
-
151
-
152
-
153
-
154
-
155
-
156
-
157
-
158
-
159
-
160
-
161
-
162
-
163
-
164
-
165
-
166
-
167
-
168
-
169
-
170
-
171
-
172
-
173
-
174
-
175
-
176
-
177
-
178
-
179
-
180
-
181
-
182
-
183
-
184
-
185
-
186
-
187
-
188
-
189
-
190
-
191
-
192
-
193
-
194
-
195
-
196
-
197
-
198
-
199
-
200
-
201
-
202
-
203
-
204
-
205
-
206
-
207
-
208
-
209
-
210
-
211
-
212
-
213
-
214
-
215
-
216
-
217
-
218
 |
 |
BlackBerry Limited
Management’s Discussion and Analysis of Financial Condition and Results of Operations
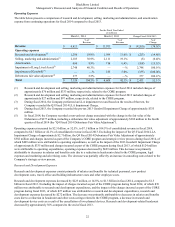
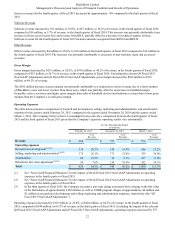
28
million, or 19.5%. The decrease was primarily attributable to decreases in salaries and benefit costs due to a reduction in
headcount related to the CORE program, as well as marketing and advertising costs and maintenance expense.
Operating expenses decreased by $666 million, or 61.1%, to $424 million, or 64.3% of revenue, in the fourth quarter of fiscal
2015, compared to $1.1 billion or 111.7% of revenue, in the fourth quarter of fiscal 2014. Excluding the impact of the relevant
Q4 Fiscal 2015 Non-GAAP Adjustments and Q4 Fiscal 2014 Non-GAAP Adjustments, operating expenses decreased by $260
million, or 45.1%. This decrease was primarily attributable to decreases in salaries and benefits due to a reduction in headcount
related to the CORE program, as well as marketing and advertising costs and amortization expense.
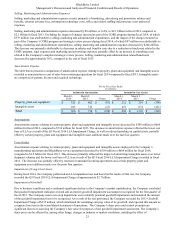
Research and Development Expense
Research and development expenses decreased by $112 million, or 45.5% to $134 million in the fourth quarter of fiscal 2015
compared to $246 million in the fourth quarter of fiscal 2014. Excluding the impact of the relevant Q4 Fiscal 2015 Non-GAAP
Adjustments and Q4 Fiscal 2014 Non-GAAP Adjustments, research and development expenses decreased by $97 million, or
43.1%. This decrease was primarily attributable to decreases in salaries and benefits costs due to a reduction in headcount
related to the CORE program and materials and facilities costs.
Selling, Marketing and Administration Expenses
Selling, marketing and administration expenses decreased by $183 million, or 51.5% to $172 million in the fourth quarter of
fiscal 2015 compared to $355 million in the fourth quarter of fiscal 2014. Excluding the impact of the relevant Q4 Fiscal 2015
Non-GAAP Adjustments and Q4 Fiscal 2014 Non-GAAP Adjustments, selling, marketing and administration expenses
decreased by $124 million, or 50.6%. This decrease was primarily attributable to decreases in foreign exchange expenses, and
marketing and advertising costs, as well as salaries and benefit costs due to a reduction in headcount related to the CORE
program.
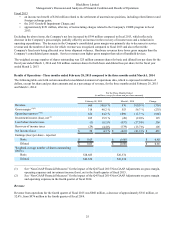
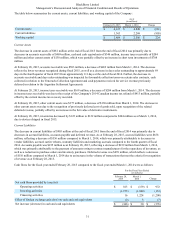
Amortization Expense
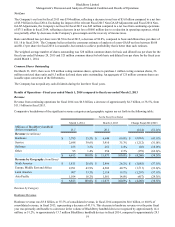
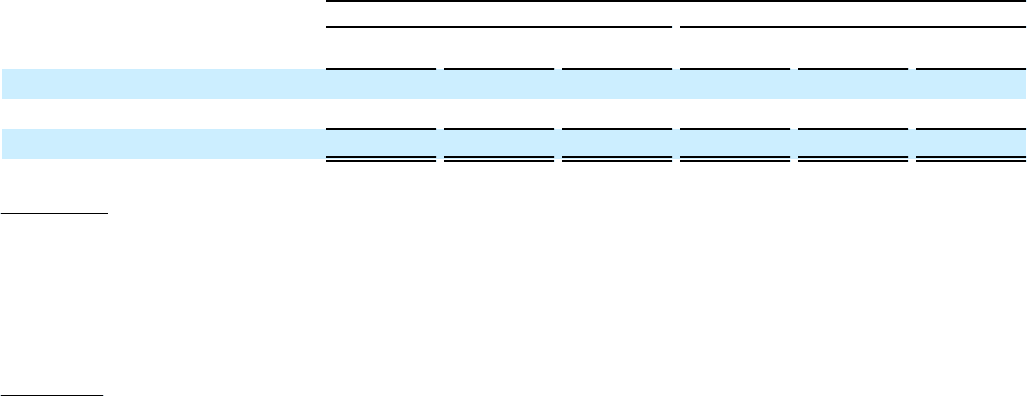
The table below presents a comparison of amortization expense relating to property, plant and equipment and intangible assets
recorded as amortization or cost of sales for the quarter ended February 28, 2015 compared to the quarter ended March 1, 2014.
Intangible assets are comprised of intellectual property and acquired technology.
For the Three Months Ended
(in millions)
Included in Amortization Included in Cost of sales
February 28,
2015 March 1,
2014 Change February 28,
2015 March 1,
2014 Change
Property, plant and equipment $ 23 $ 51 $ (28) $ 16 $ 16 $ —
Intangible assets 45 56 (11) 78 80 (2)
Total $ 68 $ 107 $ (39) $ 94 $ 96 $ (2)
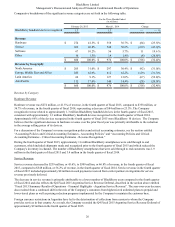
Amortization
Amortization expense relating to certain property, plant and equipment and certain intangible assets decreased by $39 million to
$68 million for the fourth quarter of fiscal 2015 compared to $107 million for the fourth quarter of fiscal 2014. The decrease in
amortization expense reflects the lower cost base of assets as a result of the Real Estate Sale and additional asset sales, as well
as reduced spending on capital and intangible assets, partially offset by certain property, plant and equipment and intangible
asset additions in the fourth quarter of fiscal 2015.
Cost of sales
Amortization expense relating to certain property, plant and equipment and certain intangible assets employed in the
Company’s manufacturing operations and BlackBerry service operations decreased slightly by $2 million to $94 million for the
fourth quarter of fiscal 2015 compared to $96 million for the fourth quarter of fiscal 2014.
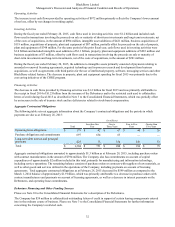
Investment Income (Loss), Net
Investment income increased by $125 million to $105 million in the fourth quarter of fiscal 2015 from a loss of $20 million in
the fourth quarter of fiscal 2014. The increase in investment income is primarily attributable to the Rockstar Sale, gains on the