Blackberry 2015 Annual Report Download - page 128
Download and view the complete annual report
Please find page 128 of the 2015 Blackberry annual report below. You can navigate through the pages in the report by either clicking on the pages listed below, or by using the keyword search tool below to find specific information within the annual report.-
 1
1 -
2
-
3
-
4
-
5
-
6
-
7
-
8
-
9
-
10
-
11
-
12
-
13
-
14
-
15
-
16
-
17
-
18
-
19
-
20
-
21
-
22
-
23
-
24
-
25
-
26
-
27
-
28
-
29
-
30
-
31
-
32
-
33
-
34
-
35
-
36
-
37
-
38
-
39
-
40
-
41
-
42
-
43
-
44
-
45
-
46
-
47
-
48
-
49
-
50
-
51
-
52
-
53
-
54
-
55
-
56
-
57
-
58
-
59
-
60
-
61
-
62
-
63
-
64
-
65
-
66
-
67
-
68
-
69
-
70
-
71
-
72
-
73
-
74
-
75
-
76
-
77
-
78
-
79
-
80
-
81
-
82
-
83
-
84
-
85
-
86
-
87
-
88
-
89
-
90
-
91
-
92
-
93
-
94
-
95
-
96
-
97
-
98
-
99
-
100
-
101
-
102
-
103
-
104
-
105
-
106
-
107
-
108
-
109
-
110
-
111
-
112
-
113
-
114
-
115
-
116
-
117
-
 118
118 -
 119
119 -
 120
120 -
 121
121 -
 122
122 -
 123
123 -
 124
124 -
 125
125 -
 126
126 -
 127
127 -
 128
128 -
 129
129 -
 130
130 -
 131
131 -
 132
132 -
 133
133 -
 134
134 -
 135
135 -
 136
136 -
 137
137 -
 138
138 -
139
-
140
-
141
-
142
-
143
-
144
-
145
-
146
-
147
-
148
-
149
-
150
-
151
-
152
-
153
-
154
-
155
-
156
-
157
-
158
-
159
-
160
-
161
-
162
-
163
-
164
-
165
-
166
-
167
-
168
-
169
-
170
-
171
-
172
-
173
-
174
-
175
-
176
-
177
-
178
-
179
-
180
-
181
-
182
-
183
-
184
-
185
-
186
-
187
-
188
-
189
-
190
-
191
-
192
-
193
-
194
-
195
-
196
-
197
-
198
-
199
-
200
-
201
-
202
-
203
-
204
-
205
-
206
-
207
-
208
-
209
-
210
-
211
-
212
-
213
-
214
-
215
-
216
-
217
-
218
 |
 |

BlackBerry Limited
Management’s Discussion and Analysis of Financial Condition and Results of Operations
17
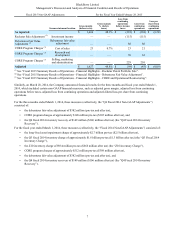
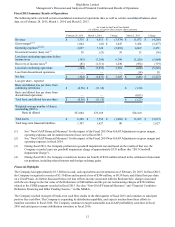
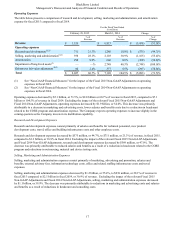
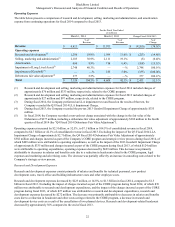
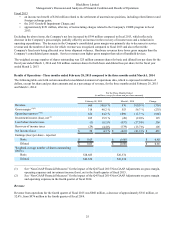
Operating Expenses
The table below presents a comparison of research and development, selling, marketing and administration, and amortization
expense for fiscal 2015 compared to fiscal 2014.
For the Fiscal Year Ended
(in millions)
February 28, 2015 March 1, 2014 Change
% of
Revenue % of
Revenue % of
Change
Revenue $ 3,335 $ 6,813 $ (3,478) (51.0)%
Operating expenses
Research and development(1)(2) 711 21.3% 1,286 18.9% $ (575) (44.7)%
Selling, marketing and administration(1)(2) 938 28.1% 2,103 30.9% (1,165) (55.4)%
Amortization 298 8.9% 606 8.9% (308) (50.8)%
Impairment of long-lived assets(2) — —% 2,748 40.3% (2,748) (100.0)%
Debentures fair value adjustment(1)(2) 80 2.4% 377 5.5% (297) (78.8)%
Total $ 2,027 60.7% $ 7,120 104.5% $ (5,093) (71.5)%
(1) See “Non-GAAP Financial Measures” for the impact of the Fiscal 2015 Non-GAAP Adjustments on operating
expenses in fiscal 2015.
(2) See “Non-GAAP Financial Measures” for the impact of the Fiscal 2014 Non-GAAP Adjustments on operating
expenses in fiscal 2014.
Operating expenses decreased by $5.1 billion, or 71.5%, to $2.0 billion or 60.7% of revenue in fiscal 2015, compared to $7.1
billion or 104.5% of revenue in fiscal 2014. Excluding the impact of the relevant Fiscal 2015 Non-GAAP Adjustments and
Fiscal 2014 Non-GAAP Adjustments, operating expenses decreased by $1.9 billion, or 54.0%. This decrease was primarily
attributable to a decrease in marketing and advertising costs, lower salaries and benefits costs due to a reduction in headcount
related to the CORE program and amortization expense. The Company expects operating expenses to increase slightly in the
coming quarters as the Company invests in its distribution capability.
Research and Development Expenses
Research and development expenses consist primarily of salaries and benefits for technical personnel, new product
development costs, travel, office and building infrastructure costs and other employee costs.
Research and development expenses decreased by $575 million, or 44.7%, to $711 million, or 21.3% of revenue, in fiscal 2015,
compared to $1.3 billion, or 18.9% in fiscal 2014. Excluding the impact of the relevant Fiscal 2015 Non-GAAP Adjustments
and Fiscal 2014 Non-GAAP Adjustments, research and development expenses decreased by $569 million, or 47.0%. The
decrease was primarily attributable to reduced salaries and benefits as a result of a reduction in headcount related to the CORE
program and reductions in outsourcing, material and device testing costs.
Selling, Marketing and Administration Expenses
Selling, marketing and administration expenses consist primarily of marketing, advertising and promotion, salaries and
benefits, external advisory fees, information technology costs, office and related staffing infrastructure costs and travel
expenses.
Selling, marketing and administration expenses decreased by $1.2 billion, or 55.4%, to $938 million, or 28.1% of revenue in
fiscal 2015 compared to $2.1 billion in fiscal 2014, or 30.9% of revenue. Excluding the impact of the relevant Fiscal 2015
Non-GAAP Adjustments and Fiscal 2014 Non-GAAP Adjustments, selling, marketing and administration expenses decreased
by $1.1 billion, or 59.9%. The decrease was primarily attributable to reductions in marketing and advertising costs and salaries
and benefits as a result of reductions in headcount and consulting costs.