Blackberry 2015 Annual Report Download - page 73
Download and view the complete annual report
Please find page 73 of the 2015 Blackberry annual report below. You can navigate through the pages in the report by either clicking on the pages listed below, or by using the keyword search tool below to find specific information within the annual report.-
 1
1 -
2
-
3
-
4
-
5
-
6
-
7
-
8
-
9
-
10
-
11
-
12
-
13
-
14
-
15
-
16
-
17
-
18
-
19
-
20
-
21
-
22
-
23
-
24
-
25
-
26
-
27
-
28
-
29
-
30
-
31
-
32
-
33
-
34
-
35
-
36
-
37
-
38
-
39
-
40
-
41
-
42
-
43
-
44
-
45
-
46
-
47
-
48
-
49
-
50
-
51
-
52
-
53
-
54
-
55
-
56
-
57
-
58
-
59
-
60
-
61
-
62
-
 63
63 -
 64
64 -
 65
65 -
 66
66 -
 67
67 -
 68
68 -
 69
69 -
 70
70 -
 71
71 -
 72
72 -
 73
73 -
 74
74 -
 75
75 -
 76
76 -
 77
77 -
 78
78 -
 79
79 -
 80
80 -
 81
81 -
 82
82 -
 83
83 -
84
-
85
-
86
-
87
-
88
-
89
-
90
-
91
-
92
-
93
-
94
-
95
-
96
-
97
-
98
-
99
-
100
-
101
-
102
-
103
-
104
-
105
-
106
-
107
-
108
-
109
-
110
-
111
-
112
-
113
-
114
-
115
-
116
-
117
-
118
-
119
-
120
-
121
-
122
-
123
-
124
-
125
-
126
-
127
-
128
-
129
-
130
-
131
-
132
-
133
-
134
-
135
-
136
-
137
-
138
-
139
-
140
-
141
-
142
-
143
-
144
-
145
-
146
-
147
-
148
-
149
-
150
-
151
-
152
-
153
-
154
-
155
-
156
-
157
-
158
-
159
-
160
-
161
-
162
-
163
-
164
-
165
-
166
-
167
-
168
-
169
-
170
-
171
-
172
-
173
-
174
-
175
-
176
-
177
-
178
-
179
-
180
-
181
-
182
-
183
-
184
-
185
-
186
-
187
-
188
-
189
-
190
-
191
-
192
-
193
-
194
-
195
-
196
-
197
-
198
-
199
-
200
-
201
-
202
-
203
-
204
-
205
-
206
-
207
-
208
-
209
-
210
-
211
-
212
-
213
-
214
-
215
-
216
-
217
-
218
 |
 |
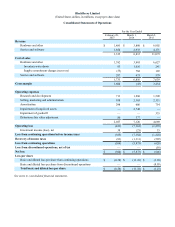
BlackBerry Limited
(United States dollars, in millions, except per share data)
Consolidated Statements of Operations
For the Year Ended
February 28,
2015 March 1,
2014 March 2,
2013
Revenue
Hardware and other $ 1,481 $ 3,880 $ 6,902
Service and software 1,854 2,933 4,171
3,335 6,813 11,073
Cost of sales
Hardware and other 1,382 3,985 6,627
Inventory write-down 95 1,616 241
Supply commitment charges (recovery) (33) 782 192
Service and software 287 473 579
1,731 6,856 7,639
Gross margin 1,604 (43) 3,434
Operating expenses
Research and development 711 1,286 1,509
Selling, marketing and administration 938 2,103 2,111
Amortization 298 606 714
Impairment of long-lived assets — 2,748 —
Impairment of goodwill — — 335
Debentures fair value adjustment 80 377 —
2,027 7,120 4,669
Operating loss (423)(7,163)(1,235)
Investment income (loss), net 38 (21) 15
Loss from continuing operations before income taxes (385)(7,184)(1,220)
Recovery of income taxes (81)(1,311)(592)
Loss from continuing operations (304)(5,873)(628)
Loss from discontinued operations, net of tax — — (18)
Net loss $(304) $ (5,873) $ (646)
Loss per share
Basic and diluted loss per share from continuing operations $(0.58) $ (11.18) $ (1.20)
Basic and diluted loss per share from discontinued operations — — (0.03)
Total basic and diluted loss per share $(0.58) $ (11.18) $ (1.23)
See notes to consolidated financial statements.