Blackberry 2015 Annual Report Download - page 136
Download and view the complete annual report
Please find page 136 of the 2015 Blackberry annual report below. You can navigate through the pages in the report by either clicking on the pages listed below, or by using the keyword search tool below to find specific information within the annual report.-
 1
1 -
2
-
3
-
4
-
5
-
6
-
7
-
8
-
9
-
10
-
11
-
12
-
13
-
14
-
15
-
16
-
17
-
18
-
19
-
20
-
21
-
22
-
23
-
24
-
25
-
26
-
27
-
28
-
29
-
30
-
31
-
32
-
33
-
34
-
35
-
36
-
37
-
38
-
39
-
40
-
41
-
42
-
43
-
44
-
45
-
46
-
47
-
48
-
49
-
50
-
51
-
52
-
53
-
54
-
55
-
56
-
57
-
58
-
59
-
60
-
61
-
62
-
63
-
64
-
65
-
66
-
67
-
68
-
69
-
70
-
71
-
72
-
73
-
74
-
75
-
76
-
77
-
78
-
79
-
80
-
81
-
82
-
83
-
84
-
85
-
86
-
87
-
88
-
89
-
90
-
91
-
92
-
93
-
94
-
95
-
96
-
97
-
98
-
99
-
100
-
101
-
102
-
103
-
104
-
105
-
106
-
107
-
108
-
109
-
110
-
111
-
112
-
113
-
114
-
115
-
116
-
117
-
118
-
119
-
120
-
121
-
122
-
123
-
124
-
125
-
 126
126 -
 127
127 -
 128
128 -
 129
129 -
 130
130 -
 131
131 -
 132
132 -
 133
133 -
 134
134 -
 135
135 -
 136
136 -
 137
137 -
 138
138 -
 139
139 -
 140
140 -
 141
141 -
 142
142 -
 143
143 -
 144
144 -
 145
145 -
 146
146 -
147
-
148
-
149
-
150
-
151
-
152
-
153
-
154
-
155
-
156
-
157
-
158
-
159
-
160
-
161
-
162
-
163
-
164
-
165
-
166
-
167
-
168
-
169
-
170
-
171
-
172
-
173
-
174
-
175
-
176
-
177
-
178
-
179
-
180
-
181
-
182
-
183
-
184
-
185
-
186
-
187
-
188
-
189
-
190
-
191
-
192
-
193
-
194
-
195
-
196
-
197
-
198
-
199
-
200
-
201
-
202
-
203
-
204
-
205
-
206
-
207
-
208
-
209
-
210
-
211
-
212
-
213
-
214
-
215
-
216
-
217
-
218
 |
 |

BlackBerry Limited
Management’s Discussion and Analysis of Financial Condition and Results of Operations
25
Fiscal 2013
• an income tax benefit of $166 million related to the settlement of uncertain tax positions, including related interest and
foreign exchange gains;
• the 2013 Goodwill Impairment Charge; and
• approximately $151 million, after-tax, of restructuring charges related to the Company's CORE program in fiscal
2013.
Excluding the above items, the Company's net loss increased by $394 million compared to fiscal 2013, which reflected a
decrease in the Company’s gross margin, partially offset by an increase in the recovery of income taxes and a reduction in
operating expenditures. The decrease in the Company's consolidated gross margin was primarily due to decreases in service
revenue and the number of devices for which revenue was recognized compared to fiscal 2013 and also reflected the
Company's fixed costs being allocated over lower shipment volumes. Hardware revenues have lower gross margins than the
Company’s consolidated gross margin. Service revenues earn higher gross margins than sales of handheld devices.
The weighted average number of shares outstanding was 525 million common shares for basic and diluted loss per share for the
fiscal year ended March 1, 2014 and 524 million common shares for both basic and diluted loss per share for the fiscal year
ended March 2, 2013.
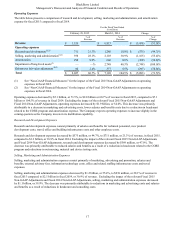
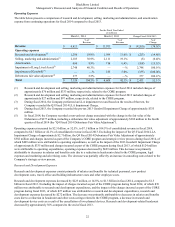
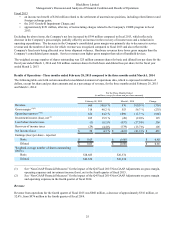
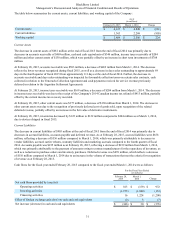
Results of Operations - Three months ended February 28, 2015 compared to the three months ended March 1, 2014
The following table sets forth certain unaudited consolidated statement of operations data, which is expressed in millions of
dollars, except for share and per share amounts and as a percentage of revenue, for the three months ended February 28, 2015
and March 1, 2014:
For the Three Months Ended
(in millions, except for share and per share amounts)
February 28, 2015 March 1, 2014 Change
Revenue 660 100.0 % 976 100.0 % (316)
Gross margin (1)(2) 318 48.2 % 553 56.7 % (235)
Operating expenses (1)(2) 424 64.2 % 1,090 111.7 % (666)
Investment income (loss), net (1) 105 15.9 % (20) (2.0)% 125
Loss before income taxes (1) (0.1)% (557) (57.0)% 556
Recovery of income taxes (29) (4.4)% (134) (13.7)% 105
Net income (loss) $ 28 4.3 % $ (423) (43.3)% $ 451
Earnings (loss) per share - reported
Basic $ 0.05 $ (0.80) $ 0.85
Diluted $ 0.05 $ (0.80) $ 0.85
Weighted-average number of shares outstanding
(000’s)
Basic 528,685 526,374
Diluted 543,556 526,374
_________________________
(1) See “Non-GAAP Financial Measures” for the impact of the Q4 Fiscal 2015 Non-GAAP Adjustments on gross margin,
operating expenses and investment income (loss), net in the fourth quarter of fiscal 2015.
(2) See “Non-GAAP Financial Measures” for the impact of the Q4 Fiscal 2014 Non-GAAP Adjustments on gross margin
and operating expenses in the fourth quarter of fiscal 2014.
Revenue
Revenue from operations for the fourth quarter of fiscal 2015 was $660 million, a decrease of approximately $316 million, or
32.4%, from $976 million in the fourth quarter of fiscal 2014.