Blackberry 2015 Annual Report Download - page 130
Download and view the complete annual report
Please find page 130 of the 2015 Blackberry annual report below. You can navigate through the pages in the report by either clicking on the pages listed below, or by using the keyword search tool below to find specific information within the annual report.-
 1
1 -
2
-
3
-
4
-
5
-
6
-
7
-
8
-
9
-
10
-
11
-
12
-
13
-
14
-
15
-
16
-
17
-
18
-
19
-
20
-
21
-
22
-
23
-
24
-
25
-
26
-
27
-
28
-
29
-
30
-
31
-
32
-
33
-
34
-
35
-
36
-
37
-
38
-
39
-
40
-
41
-
42
-
43
-
44
-
45
-
46
-
47
-
48
-
49
-
50
-
51
-
52
-
53
-
54
-
55
-
56
-
57
-
58
-
59
-
60
-
61
-
62
-
63
-
64
-
65
-
66
-
67
-
68
-
69
-
70
-
71
-
72
-
73
-
74
-
75
-
76
-
77
-
78
-
79
-
80
-
81
-
82
-
83
-
84
-
85
-
86
-
87
-
88
-
89
-
90
-
91
-
92
-
93
-
94
-
95
-
96
-
97
-
98
-
99
-
100
-
101
-
102
-
103
-
104
-
105
-
106
-
107
-
108
-
109
-
110
-
111
-
112
-
113
-
114
-
115
-
116
-
117
-
118
-
119
-
 120
120 -
 121
121 -
 122
122 -
 123
123 -
 124
124 -
 125
125 -
 126
126 -
 127
127 -
 128
128 -
 129
129 -
 130
130 -
 131
131 -
 132
132 -
 133
133 -
 134
134 -
 135
135 -
 136
136 -
 137
137 -
 138
138 -
 139
139 -
 140
140 -
141
-
142
-
143
-
144
-
145
-
146
-
147
-
148
-
149
-
150
-
151
-
152
-
153
-
154
-
155
-
156
-
157
-
158
-
159
-
160
-
161
-
162
-
163
-
164
-
165
-
166
-
167
-
168
-
169
-
170
-
171
-
172
-
173
-
174
-
175
-
176
-
177
-
178
-
179
-
180
-
181
-
182
-
183
-
184
-
185
-
186
-
187
-
188
-
189
-
190
-
191
-
192
-
193
-
194
-
195
-
196
-
197
-
198
-
199
-
200
-
201
-
202
-
203
-
204
-
205
-
206
-
207
-
208
-
209
-
210
-
211
-
212
-
213
-
214
-
215
-
216
-
217
-
218
 |
 |

BlackBerry Limited
Management’s Discussion and Analysis of Financial Condition and Results of Operations
19
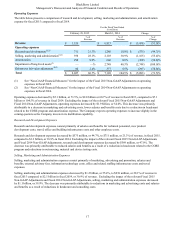
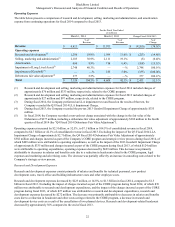
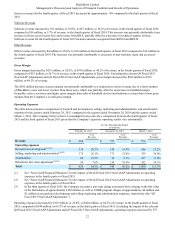
Net Loss
The Company’s net loss for fiscal 2015 was $304 million, reflecting a decrease in net loss of $5.6 billion compared to a net loss
of $5.9 billion in fiscal 2014. Excluding the impact of the relevant Fiscal 2015 Non-GAAP Adjustments and Fiscal 2014 Non-
GAAP Adjustments, the Company's net loss for fiscal 2015 was $45 million compared to a net loss from continuing operations
of $711 million in fiscal 2014, reflecting a decrease in net loss of $666 million due to a reduction in operating expenses, which
was partially offset by decreases in the Company's gross margin and the recovery of income taxes.
Basic and diluted loss per share were $0.58 in fiscal 2015, a decrease of 94.8%, compared to basic and diluted loss per share of
$11.18 in fiscal 2014. The Company believes that the consensus estimate of analysts of a non-GAAP net loss between $0.08
and $0.13 per share for fiscal 2016 is reasonable, but intends to achieve profitability that is better than such estimate.
The weighted average number of shares outstanding was 528 million common shares for basic and diluted loss per share for the
fiscal year ended February 28, 2015 and 525 million common shares for both basic and diluted loss per share for the fiscal year
ended March 1, 2014.
Common Shares Outstanding
On March 23, 2015, there were 529 million voting common shares, options to purchase 1 million voting common shares, 26
million restricted share units and 0.3 million deferred share units outstanding. An aggregate of 125 million common shares are
issuable upon conversion of the Debentures.
The Company has not paid any cash dividends during the last three fiscal years.
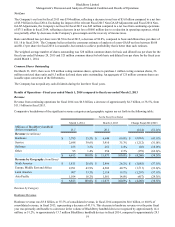
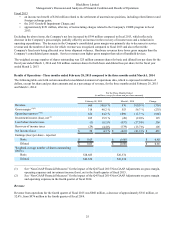
Results of Operations - Fiscal year ended March 1, 2014 compared to fiscal year ended March 2, 2013
Revenue
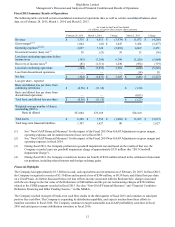
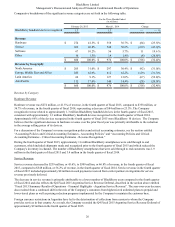
Revenue from continuing operations for fiscal 2014 was $6.8 billion, a decrease of approximately $4.3 billion, or 38.5%, from
$11.1 billion in fiscal 2013.
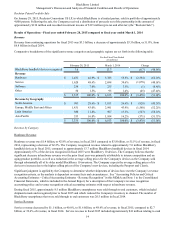
Comparative breakdowns of the significant revenue categories and geographic regions are set forth in the following table:
For the Fiscal Year Ended
March 1, 2014 March 2, 2013 Change Fiscal 2014/2013
Millions of BlackBerry handheld
devices recognized 13.7 28.1 (14.4) (51.2)%
Revenue (in millions)
Hardware $ 3,785 55.5% $ 6,648 60.0% $ (2,863) (43.1)%
Service 2,698 39.6% 3,910 35.3% (1,212) (31.0)%
Software 235 3.5% 261 2.4% (26) (10.0)%
Other 95 1.4% 254 2.3% (159) (62.6)%
$ 6,813 100.0% $ 11,073 100.0% $ (4,260) (38.5)%
Revenue by Geography (in millions)
North America $ 1,811 26.6% $ 2,896 26.2% $ (1,085) (37.5)%
Europe, Middle East and Africa 2,991 43.9% 4,502 40.7% (1,511) (33.6)%
Latin America 907 13.3% 2,114 19.1% (1,207) (57.1)%
Asia Pacific 1,104 16.2% 1,561 14.0% (457) (29.3)%
$ 6,813 100.0% $ 11,073 100.0% $ (4,260) (38.5)%
Revenue by Category
Hardware Revenue
Hardware revenue was $3.8 billion, or 55.5% of consolidated revenue, in fiscal 2014 compared to $6.6 billion, or 60.0% of
consolidated revenue, in fiscal 2013, representing a decrease of 43.1%. This decrease in hardware revenue over the prior fiscal
year was primarily attributable to a decrease in the volume of BlackBerry handheld devices recognized by approximately 14.4
million, or 51.2%, to approximately 13.7 million BlackBerry handheld devices in fiscal 2014, compared to approximately 28.1