Blackberry 2015 Annual Report Download - page 110
Download and view the complete annual report
Please find page 110 of the 2015 Blackberry annual report below. You can navigate through the pages in the report by either clicking on the pages listed below, or by using the keyword search tool below to find specific information within the annual report.-
 1
1 -
2
-
3
-
4
-
5
-
6
-
7
-
8
-
9
-
10
-
11
-
12
-
13
-
14
-
15
-
16
-
17
-
18
-
19
-
20
-
21
-
22
-
23
-
24
-
25
-
26
-
27
-
28
-
29
-
30
-
31
-
32
-
33
-
34
-
35
-
36
-
37
-
38
-
39
-
40
-
41
-
42
-
43
-
44
-
45
-
46
-
47
-
48
-
49
-
50
-
51
-
52
-
53
-
54
-
55
-
56
-
57
-
58
-
59
-
60
-
61
-
62
-
63
-
64
-
65
-
66
-
67
-
68
-
69
-
70
-
71
-
72
-
73
-
74
-
75
-
76
-
77
-
78
-
79
-
80
-
81
-
82
-
83
-
84
-
85
-
86
-
87
-
88
-
89
-
90
-
91
-
92
-
93
-
94
-
95
-
96
-
97
-
98
-
99
-
 100
100 -
 101
101 -
 102
102 -
 103
103 -
 104
104 -
 105
105 -
 106
106 -
 107
107 -
 108
108 -
 109
109 -
 110
110 -
 111
111 -
 112
112 -
 113
113 -
 114
114 -
 115
115 -
 116
116 -
 117
117 -
 118
118 -
 119
119 -
 120
120 -
121
-
122
-
123
-
124
-
125
-
126
-
127
-
128
-
129
-
130
-
131
-
132
-
133
-
134
-
135
-
136
-
137
-
138
-
139
-
140
-
141
-
142
-
143
-
144
-
145
-
146
-
147
-
148
-
149
-
150
-
151
-
152
-
153
-
154
-
155
-
156
-
157
-
158
-
159
-
160
-
161
-
162
-
163
-
164
-
165
-
166
-
167
-
168
-
169
-
170
-
171
-
172
-
173
-
174
-
175
-
176
-
177
-
178
-
179
-
180
-
181
-
182
-
183
-
184
-
185
-
186
-
187
-
188
-
189
-
190
-
191
-
192
-
193
-
194
-
195
-
196
-
197
-
198
-
199
-
200
-
201
-
202
-
203
-
204
-
205
-
206
-
207
-
208
-
209
-
210
-
211
-
212
-
213
-
214
-
215
-
216
-
217
-
218
 |
 |

BlackBerry Limited
Notes to the Consolidated Financial Statements
In millions of United States dollars, except share and per share data, and except as otherwise indicated
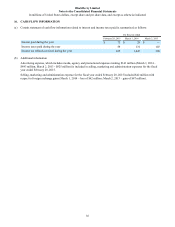
35
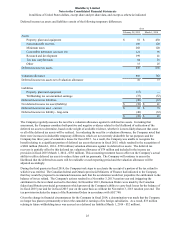
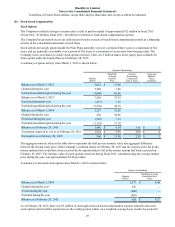
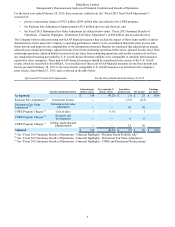
Revenue from continuing operations, classified by major geographic segments in which the Company’s customers are
located, was as follows:
For the year ended
February 28, 2015 March 1, 2014 March 2, 2013
North America
Canada $ 216 6.4% $ 491 7.2% $ 661 6.0%
United States 775 23.2% 1,320 19.4% 2,235 20.2%
991 29.6% 1,811 26.6% 2,896 26.2%
Europe, Middle East and Africa
United Kingdom 292 8.8% 604 8.9% 1,238 11.2%
Other 1,139 34.2% 2,387 35.0% 3,264 29.5%
1,431 43.0% 2,991 43.9% 4,502 40.7%
Latin America 380 11.4% 907 13.3% 2,114 19.1%
Asia Pacific 533 16.0% 1,104 16.2% 1,561 14.0%
$ 3,335 100.0% $ 6,813 100.0% $ 11,073 100.0%
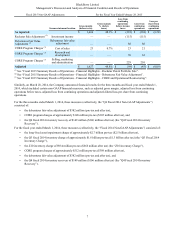
For the year ended
February 28, 2015 March 1, 2014 March 2, 2013
Revenue mix
Hardware $ 1,431 $ 3,785 $ 6,648
Service 1,620 2,698 3,910
Software 234 235 261
Other 50 95 254
$ 3,335 $ 6,813 $ 11,073
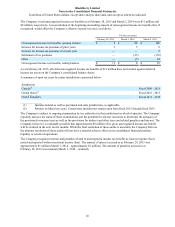
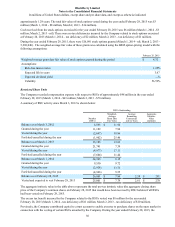
Property, plant and equipment, intangible assets and goodwill, classified by geographic segments in which the Company’s
assets are located, was as follows:
As at
February 28, 2015 March 1, 2014
Property, plant and
equipment, intangible
assets and goodwill Total assets
Property, plant and
equipment, intangible
assets and goodwill Total assets
Canada $ 1,628 $ 3,368 $ 2,225 $ 2,362
United States 202 2,700 275 2,207
United Kingdom 79 126 7 954
Other 98 355 68 2,029
$ 2,007 $ 6,549 $ 2,575 $ 7,552
Information about major customers
There were no customers that comprised more than 10% of the Company’s revenue in fiscal 2015 and fiscal 2014 – no
customers that comprised more than 10%; fiscal 2013 – no customers that comprised more than 10%).