Blackberry 2015 Annual Report Download - page 138
Download and view the complete annual report
Please find page 138 of the 2015 Blackberry annual report below. You can navigate through the pages in the report by either clicking on the pages listed below, or by using the keyword search tool below to find specific information within the annual report.-
 1
1 -
2
-
3
-
4
-
5
-
6
-
7
-
8
-
9
-
10
-
11
-
12
-
13
-
14
-
15
-
16
-
17
-
18
-
19
-
20
-
21
-
22
-
23
-
24
-
25
-
26
-
27
-
28
-
29
-
30
-
31
-
32
-
33
-
34
-
35
-
36
-
37
-
38
-
39
-
40
-
41
-
42
-
43
-
44
-
45
-
46
-
47
-
48
-
49
-
50
-
51
-
52
-
53
-
54
-
55
-
56
-
57
-
58
-
59
-
60
-
61
-
62
-
63
-
64
-
65
-
66
-
67
-
68
-
69
-
70
-
71
-
72
-
73
-
74
-
75
-
76
-
77
-
78
-
79
-
80
-
81
-
82
-
83
-
84
-
85
-
86
-
87
-
88
-
89
-
90
-
91
-
92
-
93
-
94
-
95
-
96
-
97
-
98
-
99
-
100
-
101
-
102
-
103
-
104
-
105
-
106
-
107
-
108
-
109
-
110
-
111
-
112
-
113
-
114
-
115
-
116
-
117
-
118
-
119
-
120
-
121
-
122
-
123
-
124
-
125
-
126
-
127
-
 128
128 -
 129
129 -
 130
130 -
 131
131 -
 132
132 -
 133
133 -
 134
134 -
 135
135 -
 136
136 -
 137
137 -
 138
138 -
 139
139 -
 140
140 -
 141
141 -
 142
142 -
 143
143 -
 144
144 -
 145
145 -
 146
146 -
 147
147 -
 148
148 -
149
-
150
-
151
-
152
-
153
-
154
-
155
-
156
-
157
-
158
-
159
-
160
-
161
-
162
-
163
-
164
-
165
-
166
-
167
-
168
-
169
-
170
-
171
-
172
-
173
-
174
-
175
-
176
-
177
-
178
-
179
-
180
-
181
-
182
-
183
-
184
-
185
-
186
-
187
-
188
-
189
-
190
-
191
-
192
-
193
-
194
-
195
-
196
-
197
-
198
-
199
-
200
-
201
-
202
-
203
-
204
-
205
-
206
-
207
-
208
-
209
-
210
-
211
-
212
-
213
-
214
-
215
-
216
-
217
-
218
 |
 |
BlackBerry Limited
Management’s Discussion and Analysis of Financial Condition and Results of Operations
27
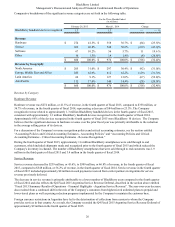
Service revenues for the fourth quarter of fiscal 2015 decreased by approximately 16% compared to the third quarter of fiscal
2015.
Software Revenue
Software revenue increased by $11 million, or 19.6%, to $67 million, or 10.2% of revenue, in the fourth quarter of fiscal 2015,
compared to $56 million, or 5.7% of revenue, in the fourth quarter of fiscal 2014. This increase was primarily attributable to an
increase in client access license fees and revenue from QNX, partially offset by a decrease in technical support revenue.
Software revenue for the fourth quarter of fiscal 2015 includes amounts recognized from BES10 and BES12.
Other Revenue
Other revenue decreased by $4 million or 28.6%, to $10 million in the fourth quarter of fiscal 2015 compared to $14 million in
the fourth quarter of fiscal 2014. The decrease was primarily attributable to decreases in non-warranty repair and accessory
revenues.
Gross Margin
Gross margin decreased by $235 million, or 42.5%, to $318 million, or 48.2% of revenue, in the fourth quarter of fiscal 2015,
compared to $553 million, or 56.7% of revenue, in the fourth quarter of fiscal 2014. Excluding the relevant Q4 Fiscal 2015
Non-GAAP Adjustments and Q4 Fiscal 2014 Non-GAAP Adjustments, gross margin decreased by $102 million to $319
million, or 48.3% of revenue.
The $102 million decrease in gross margin was primarily attributable to a reduction in service revenue due to a lower number
of BlackBerry users and lower revenue from those users, which was partially offset by an increase in handheld margin.
Generally, service revenues earn higher gross margins than sales of handheld devices and hardware revenues have lower gross
margins than the Company’s overall gross margin.
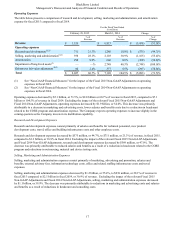
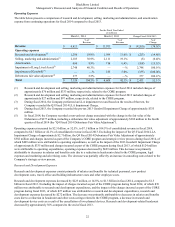
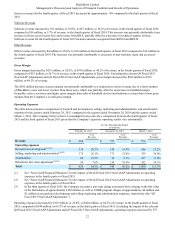
Operating Expenses
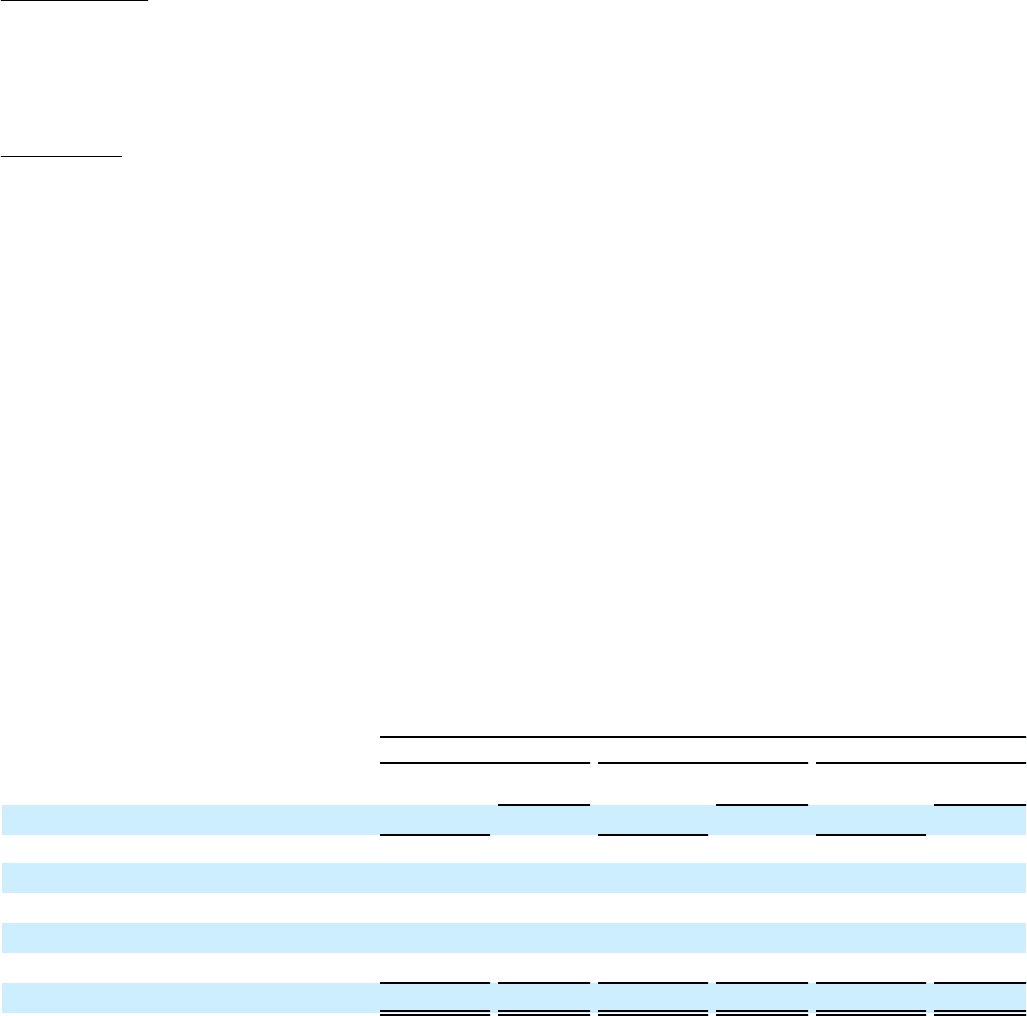
The table below presents a comparison of research and development, selling, marketing and administration, and amortization
expenses for the quarter ended February 28, 2015, compared to the quarter ended November 29, 2014 and the quarter ended
March 1, 2014. The Company believes that it is meaningful to also provide a comparison between the fourth quarter of fiscal
2015 and the third quarter of fiscal 2015 given that the Company’s quarterly operating results vary substantially.
For the Three Months Ended
(in millions)
February 28, 2015 November 29, 2014 March 1, 2014
% of
Revenue % of
Revenue % of
Revenue
Revenue $ 660 $ 793 $ 976
Operating expenses
Research and development(1)(2)(3) 134 20.3% 154 19.4% 246 25.2%
Selling, marketing and administration(1)(2)(3) 172 26.1% 171 21.6% 355 36.4%
Amortization 68 10.3% 74 9.3% 107 11.0%
Debentures fair value adjustment(1)(2)(3) 50 7.6% 150 18.9% 382 39.1%
Total $ 424 64.3% $ 549 69.2% $ 1,090 111.7%
(1) See “Non-GAAP Financial Measures” for the impact of the Q4 Fiscal 2015 Non-GAAP Adjustments on operating
expenses in the fourth quarter of fiscal 2015.
(2) See “Non-GAAP Financial Measures” for the impact of the Q4 Fiscal 2014 Non-GAAP Adjustments on operating
expenses in the fourth quarter of fiscal 2014.
(3) In the third quarter of fiscal 2015, the Company recorded a non-cash charge associated with a change in the fair value
of the Debentures of approximately $150 million, as well as CORE program charges of approximately $4 million and
$1 million in research and development and selling, marketing and administration expenses, respectively (the “Q3
Fiscal 2015 Non-GAAP Adjustments”).
Operating expenses decreased by $125 million, or 22.8%, to $424 million, or 64.3% of revenue, in the fourth quarter of fiscal
2015, compared to $549 million, or 69.2% of revenue, in the third quarter of fiscal 2015. Excluding the impact of the relevant
Q4 Fiscal 2015 Non-GAAP Adjustments and Q3 Fiscal 2015 Non-GAAP Adjustments, operating expenses decreased by $77