Blackberry 2015 Annual Report Download - page 123
Download and view the complete annual report
Please find page 123 of the 2015 Blackberry annual report below. You can navigate through the pages in the report by either clicking on the pages listed below, or by using the keyword search tool below to find specific information within the annual report.-
 1
1 -
2
-
3
-
4
-
5
-
6
-
7
-
8
-
9
-
10
-
11
-
12
-
13
-
14
-
15
-
16
-
17
-
18
-
19
-
20
-
21
-
22
-
23
-
24
-
25
-
26
-
27
-
28
-
29
-
30
-
31
-
32
-
33
-
34
-
35
-
36
-
37
-
38
-
39
-
40
-
41
-
42
-
43
-
44
-
45
-
46
-
47
-
48
-
49
-
50
-
51
-
52
-
53
-
54
-
55
-
56
-
57
-
58
-
59
-
60
-
61
-
62
-
63
-
64
-
65
-
66
-
67
-
68
-
69
-
70
-
71
-
72
-
73
-
74
-
75
-
76
-
77
-
78
-
79
-
80
-
81
-
82
-
83
-
84
-
85
-
86
-
87
-
88
-
89
-
90
-
91
-
92
-
93
-
94
-
95
-
96
-
97
-
98
-
99
-
100
-
101
-
102
-
103
-
104
-
105
-
106
-
107
-
108
-
109
-
110
-
111
-
112
-
 113
113 -
 114
114 -
 115
115 -
 116
116 -
 117
117 -
 118
118 -
 119
119 -
 120
120 -
 121
121 -
 122
122 -
 123
123 -
 124
124 -
 125
125 -
 126
126 -
 127
127 -
 128
128 -
 129
129 -
 130
130 -
 131
131 -
 132
132 -
 133
133 -
134
-
135
-
136
-
137
-
138
-
139
-
140
-
141
-
142
-
143
-
144
-
145
-
146
-
147
-
148
-
149
-
150
-
151
-
152
-
153
-
154
-
155
-
156
-
157
-
158
-
159
-
160
-
161
-
162
-
163
-
164
-
165
-
166
-
167
-
168
-
169
-
170
-
171
-
172
-
173
-
174
-
175
-
176
-
177
-
178
-
179
-
180
-
181
-
182
-
183
-
184
-
185
-
186
-
187
-
188
-
189
-
190
-
191
-
192
-
193
-
194
-
195
-
196
-
197
-
198
-
199
-
200
-
201
-
202
-
203
-
204
-
205
-
206
-
207
-
208
-
209
-
210
-
211
-
212
-
213
-
214
-
215
-
216
-
217
-
218
 |
 |

BlackBerry Limited
Management’s Discussion and Analysis of Financial Condition and Results of Operations
12
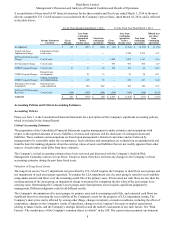
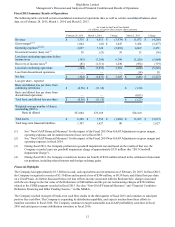
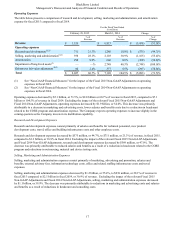
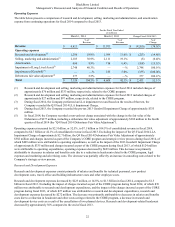
Fiscal 2015 Summary Results of Operations
The following table sets forth certain consolidated statement of operations data, as well as certain consolidated balance sheet
data, as at February 28, 2015, March 1, 2014, and March 2, 2013.
As at and for the Fiscal Year Ended
(in millions, except for share and per share amounts)
February 28, 2015 March 1, 2014 Change March 2, 2013 Change
Revenue $ 3,335 $ 6,813 $ (3,478) $ 11,073 $ (4,260)
Gross margin(1)(2) 1,604 (43) $ 1,647 3,434 (3,477)
Operating expenses(1)(2)(3) 2,027 7,120 (5,093) 4,669 2,451
Investment income (loss), net (1) 38 (21) 59 15 (36)
Loss from continuing operations before
income taxes (385) (7,184) 6,799 (1,220)(5,964)
Recovery of income taxes(4) (81) (1,311) 1,230 (592)(719)
Loss from continuing operations (304) (5,873) 5,569 (628)(5,245)
Loss from discontinued operations — — — (18) 18
Net loss $ (304) $ (5,873) $ 5,569 $ (646) $ (5,227)
Loss per share - reported
Basic and diluted loss per share from
continuing operations $ (0.58) $ (11.18) $ (1.20)
Basic and diluted loss per share from
discontinued operations — — (0.03)
Total basic and diluted loss per share $ (0.58) $ (11.18) $ (1.23)
Weighted-average number of shares
outstanding (000’s)
Basic & diluted 527,684 525,168 524,160
Total assets $ 6,549 $ 7,552 $ (1,003) $ 13,165 $ (5,613)
Total long-term financial liabilities 1,707 1,627 80 — 1,627
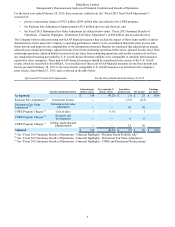
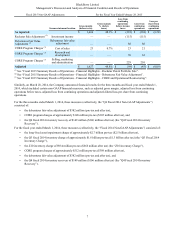
(1) See “Non-GAAP Financial Measures” for the impact of the Fiscal 2015 Non-GAAP Adjustments on gross margin,
operating expenses and investment income (loss), net in fiscal 2015.
(2) See “Non-GAAP Financial Measures” for the impact of the Fiscal 2014 Non-GAAP Adjustments on gross margin and
operating expenses in fiscal 2014.
(3) During fiscal 2013, the Company performed a goodwill impairment test and based on the results of that test, the
Company recorded a pre-tax goodwill impairment charge of approximately $335 million (the “2013 Goodwill
Impairment Charge”).
(4) During fiscal 2013, the Company recorded an income tax benefit of $166 million related to the settlement of uncertain
tax positions, including related interest and foreign exchange gains.
Financial Highlights
The Company had approximately $3.3 billion in cash, cash equivalents and investments as of February 28, 2015. In fiscal 2015,
the Company recognized revenues of $3.3 billion and incurred a loss of $304 million, or $0.58 basic and diluted loss per share
on a GAAP basis. As further discussed below, net loss reflects income associated with the Rockstar Sale, charges associated
with the net change in the fair value of the Debentures of $80 million and the pre-tax restructuring charges of $322 million
related to the CORE program recorded in fiscal 2015. See also “Non-GAAP Financial Measures” and “Financial Condition -
Debenture Financing and Other Funding Sources ” in this MD&A.
The Company reached its target of break-even cash flow results in the third quarter of fiscal 2015 and continues to anticipate
positive free cash flow. The Company is expanding its distribution capability, and expects traction from these efforts to
manifest sometime in fiscal 2016. The Company continues to target sustainable non-GAAP profitability sometime in fiscal
2016 and anticipates revenue stabilization sometime in fiscal 2016.