Blackberry 2015 Annual Report Download - page 133
Download and view the complete annual report
Please find page 133 of the 2015 Blackberry annual report below. You can navigate through the pages in the report by either clicking on the pages listed below, or by using the keyword search tool below to find specific information within the annual report.-
 1
1 -
2
-
3
-
4
-
5
-
6
-
7
-
8
-
9
-
10
-
11
-
12
-
13
-
14
-
15
-
16
-
17
-
18
-
19
-
20
-
21
-
22
-
23
-
24
-
25
-
26
-
27
-
28
-
29
-
30
-
31
-
32
-
33
-
34
-
35
-
36
-
37
-
38
-
39
-
40
-
41
-
42
-
43
-
44
-
45
-
46
-
47
-
48
-
49
-
50
-
51
-
52
-
53
-
54
-
55
-
56
-
57
-
58
-
59
-
60
-
61
-
62
-
63
-
64
-
65
-
66
-
67
-
68
-
69
-
70
-
71
-
72
-
73
-
74
-
75
-
76
-
77
-
78
-
79
-
80
-
81
-
82
-
83
-
84
-
85
-
86
-
87
-
88
-
89
-
90
-
91
-
92
-
93
-
94
-
95
-
96
-
97
-
98
-
99
-
100
-
101
-
102
-
103
-
104
-
105
-
106
-
107
-
108
-
109
-
110
-
111
-
112
-
113
-
114
-
115
-
116
-
117
-
118
-
119
-
120
-
121
-
122
-
 123
123 -
 124
124 -
 125
125 -
 126
126 -
 127
127 -
 128
128 -
 129
129 -
 130
130 -
 131
131 -
 132
132 -
 133
133 -
 134
134 -
 135
135 -
 136
136 -
 137
137 -
 138
138 -
 139
139 -
 140
140 -
 141
141 -
 142
142 -
 143
143 -
144
-
145
-
146
-
147
-
148
-
149
-
150
-
151
-
152
-
153
-
154
-
155
-
156
-
157
-
158
-
159
-
160
-
161
-
162
-
163
-
164
-
165
-
166
-
167
-
168
-
169
-
170
-
171
-
172
-
173
-
174
-
175
-
176
-
177
-
178
-
179
-
180
-
181
-
182
-
183
-
184
-
185
-
186
-
187
-
188
-
189
-
190
-
191
-
192
-
193
-
194
-
195
-
196
-
197
-
198
-
199
-
200
-
201
-
202
-
203
-
204
-
205
-
206
-
207
-
208
-
209
-
210
-
211
-
212
-
213
-
214
-
215
-
216
-
217
-
218
 |
 |

BlackBerry Limited
Management’s Discussion and Analysis of Financial Condition and Results of Operations
22
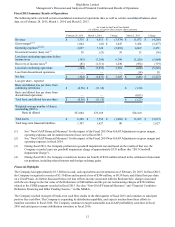
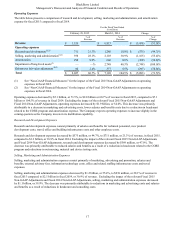
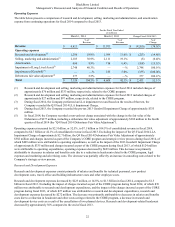
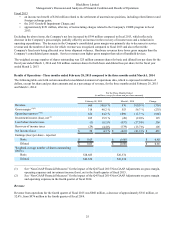
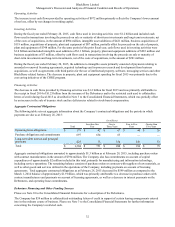
Operating Expenses
The table below presents a comparison of research and development, selling, marketing and administration, and amortization
expense from continuing operations for fiscal 2014 compared to fiscal 2013.
For the Fiscal Year Ended
(in millions)
March 1, 2014 March 2, 2013 Change Fiscal 2014/2013
% of
Revenue % of
Revenue % of
Change
Revenue $ 6,813 $ 11,073 $ (4,260) (38.5)%
Operating expenses
Research and development(1) 1,286 18.9% 1,509 13.6% $ (223) (14.8)%
Selling, marketing and administration(1) 2,103 30.9% 2,111 19.1% (8) (0.4)%
Amortization 606 8.9% 714 6.4% (108) (15.1)%
Impairment of Long Lived Assets(2) 2,748 40.3% — —% 2,748 100.0 %
Impairment of Goodwill(3) — —% 335 3.0% (335) (100.0)%
Debentures fair value adjustment(4) 377 5.5% — —% 377 100.0 %
Total $ 7,120 104.5% $ 4,669 42.1% $ 2,451 52.5 %
(1) Research and development and selling, marketing and administration expenses for fiscal 2014 included charges of
approximately $76 million and $333 million, respectively, related to the CORE program.
(2) Research and development and selling, marketing and administration expenses for fiscal 2013 included charges of
approximately $27 million and $97 million, respectively, related to the CORE program.
(3) During fiscal 2014, the Company performed an LLA impairment test and based on the results of that test, the
Company recorded the Q3 Fiscal 2014 LLA Impairment Charge.
(4) During fiscal 2013, the Company recorded the pre-tax 2013 Goodwill Impairment Charge of approximately $335
million.
(5) In fiscal 2014, the Company recorded a non-cash net charge associated with the change in the fair value of the
Debentures of $377 million, including a debentures fair value adjustment of approximately $382 million in the fourth
quarter of fiscal 2014 (the “Q4 Fiscal 2014 Debentures Fair Value Adjustment”).
Operating expenses increased by $2.5 billion, or 52.5%, to $7.1 billion or 104.5% of consolidated revenue in fiscal 2014,
compared to $4.7 billion or 42.1% of consolidated revenue in fiscal 2013. Excluding the impact of the Q3 Fiscal 2014 LLA
Impairment Charge of approximately $2.7 billion, the Q4 Fiscal 2014 Debentures Fair Value Adjustment of approximately
$382 million and charges incurred as part of the Company’s CORE program and strategic review process during fiscal 2014, of
which $409 million were attributable to operating expenditures, as well as the impact of the 2013 Goodwill Impairment Charge
of approximately $335 million and charges incurred as part of the CORE program during fiscal 2013, of which $124 million
were attributable to operating expenditures, operating expenses decreased by $629 million. This decrease was primarily
attributable to decreases in salaries and benefits costs due to a reduction in headcount related to the CORE program, legal
expenses and marketing and advertising costs. The decrease was partially offset by an increase in consulting costs related to the
Company's strategic review process.
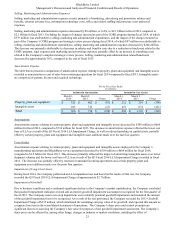
Research and Development Expenses
Research and development expenses consist primarily of salaries and benefits for technical personnel, new product
development costs, travel, office and building infrastructure costs and other employee costs.
Research and development expenses decreased by $223 million, or 14.8%, to $1.3 billion in fiscal 2014, compared to $1.5
billion in fiscal 2013. Excluding the impact of charges incurred as part of the CORE program during fiscal 2014, of which $76
million was attributable to research and development expenditures, and the impact of the charges incurred as part of the CORE
program during fiscal 2013, of which $27 million was attributable to research and development expenditures, research and
development expenses decreased by $272 million. The decrease was primarily attributable to decreases in salaries and benefits
costs due to a reduction in headcount and other costs savings related to the CORE program, a decrease in research and
development device costs as a result of the cancellation of two planned devices. Research and development-related headcount
decreased by approximately 30% compared to the end of fiscal 2013.