Blackberry 2015 Annual Report Download - page 85
Download and view the complete annual report
Please find page 85 of the 2015 Blackberry annual report below. You can navigate through the pages in the report by either clicking on the pages listed below, or by using the keyword search tool below to find specific information within the annual report.-
 1
1 -
2
-
3
-
4
-
5
-
6
-
7
-
8
-
9
-
10
-
11
-
12
-
13
-
14
-
15
-
16
-
17
-
18
-
19
-
20
-
21
-
22
-
23
-
24
-
25
-
26
-
27
-
28
-
29
-
30
-
31
-
32
-
33
-
34
-
35
-
36
-
37
-
38
-
39
-
40
-
41
-
42
-
43
-
44
-
45
-
46
-
47
-
48
-
49
-
50
-
51
-
52
-
53
-
54
-
55
-
56
-
57
-
58
-
59
-
60
-
61
-
62
-
63
-
64
-
65
-
66
-
67
-
68
-
69
-
70
-
71
-
72
-
73
-
74
-
 75
75 -
 76
76 -
 77
77 -
 78
78 -
 79
79 -
 80
80 -
 81
81 -
 82
82 -
 83
83 -
 84
84 -
 85
85 -
 86
86 -
 87
87 -
 88
88 -
 89
89 -
 90
90 -
 91
91 -
 92
92 -
 93
93 -
 94
94 -
 95
95 -
96
-
97
-
98
-
99
-
100
-
101
-
102
-
103
-
104
-
105
-
106
-
107
-
108
-
109
-
110
-
111
-
112
-
113
-
114
-
115
-
116
-
117
-
118
-
119
-
120
-
121
-
122
-
123
-
124
-
125
-
126
-
127
-
128
-
129
-
130
-
131
-
132
-
133
-
134
-
135
-
136
-
137
-
138
-
139
-
140
-
141
-
142
-
143
-
144
-
145
-
146
-
147
-
148
-
149
-
150
-
151
-
152
-
153
-
154
-
155
-
156
-
157
-
158
-
159
-
160
-
161
-
162
-
163
-
164
-
165
-
166
-
167
-
168
-
169
-
170
-
171
-
172
-
173
-
174
-
175
-
176
-
177
-
178
-
179
-
180
-
181
-
182
-
183
-
184
-
185
-
186
-
187
-
188
-
189
-
190
-
191
-
192
-
193
-
194
-
195
-
196
-
197
-
198
-
199
-
200
-
201
-
202
-
203
-
204
-
205
-
206
-
207
-
208
-
209
-
210
-
211
-
212
-
213
-
214
-
215
-
216
-
217
-
218
 |
 |

BlackBerry Limited
Notes to the Consolidated Financial Statements
In millions of United States dollars, except share and per share data, and except as otherwise indicated
10
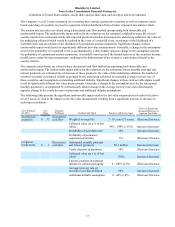
The fair value hierarchy also requires the Company to maximize the use of observable inputs and minimize the use of
unobservable inputs when measuring fair value.
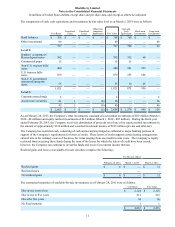
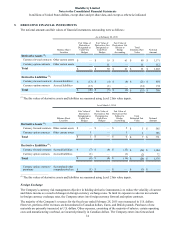
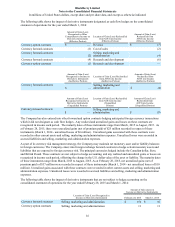
The components of cash, cash equivalents and investments by fair value level as at February 28, 2015 were as follows:
Cost Basis Unrealized
Gains Unrealized
Losses
Other-than-
temporary
Impairment Fair Value
Cash and
Cash
Equivalents Short-term
Investments Long-term
Investments Restricted
Cash
Bank balances $ 765 $ — $ — — $ 765 $ 765 $ — $ — $ —
Other investments 66———66——66—
831 — — — 831 765 — 66 —
Level 1:
Money market funds 1——— 1 1———
Level 2:
Term deposits,
certificates of deposit,
and GICs 218 1 — — 219 76 84 — 59
Commercial paper 710 — — — 710 240 470 — —
Non-U.S. promissory
notes 100 — — — 100 — 100 — —
Non-U.S. treasury
bills/notes 244 — — — 244 151 93 — —
U.S. treasury bills/
notes 915 — — — 915 — 705 210 —
Non-U.S. government
sponsored enterprise
notes 49———49—49——
U.S. government
sponsored enterprise
notes 149 — — — 149 — 149 — —
Corporate notes/bonds 8——— 8— 8——
2,393 1 — — 2,394 467 1,658 210 59
Level 3:
Corporate notes/bonds 3——— 3—— 3—
Auction-rate securities 41 2 — (6) 37 — — 37 —
$ 44 $ 2 $ — $ (6) $ 40 $ — $ — $ 40 $ —
$ 3,269 $ 3 $ — $ (6) $ 3,266 $ 1,233 $ 1,658 $ 316 $ 59